Ubuntu 18.04
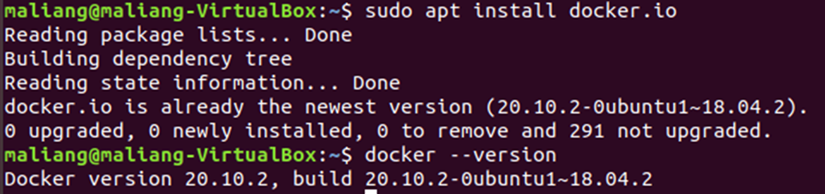
1. Install the Docker package through the apt install command.
$ sudo apt install docker.io
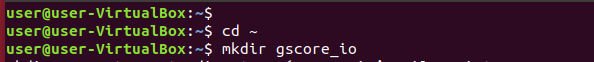
2. Move to folder of /home/[username] and create a folder to store input and output data.
$ cd ~
$ mkdir gscore_io
Put the input file to the folder. Example download

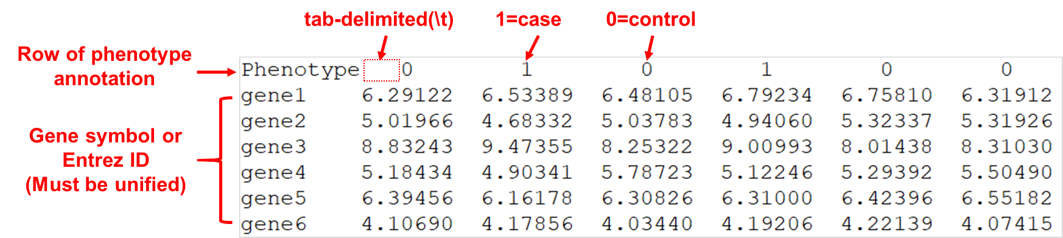
Input expression data file format demo:
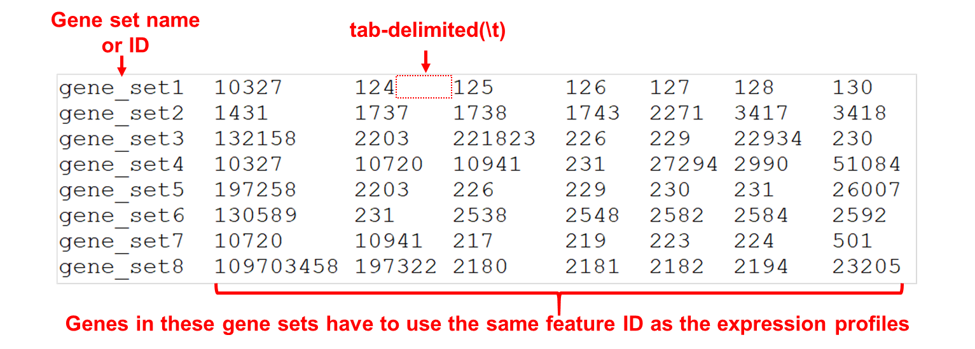
Input gene set list file format demo:
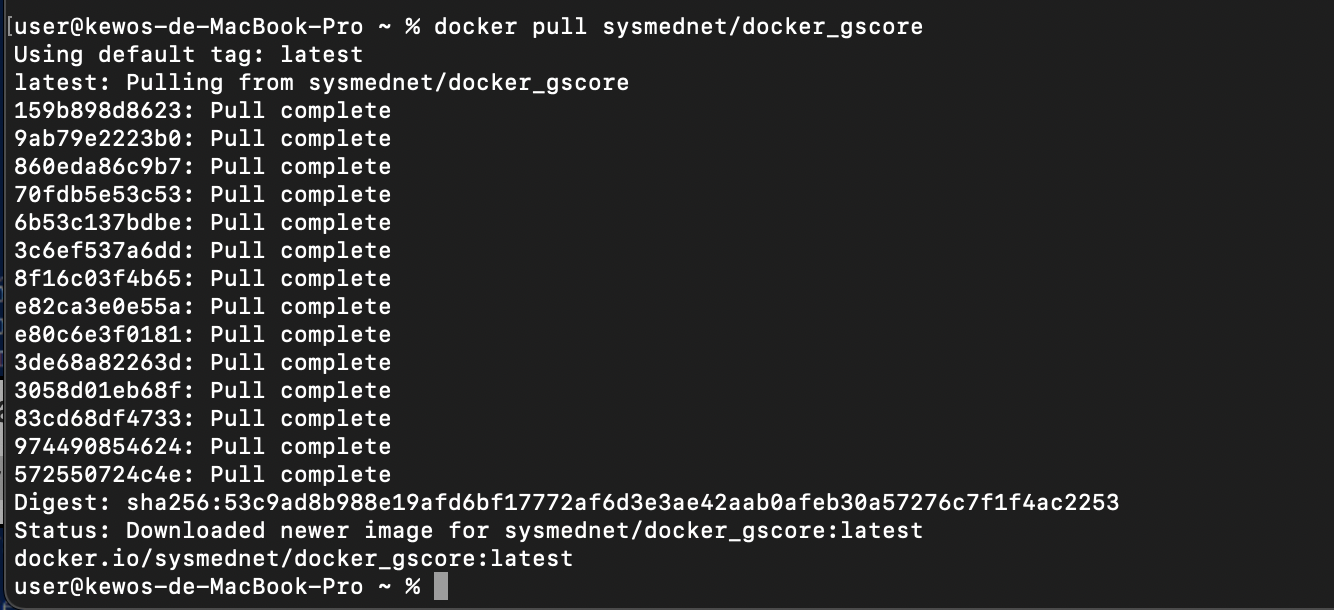
3. Download Gscore Docker images from Docker hub by following command.
$ docker pull sysmednet/docker_gscore
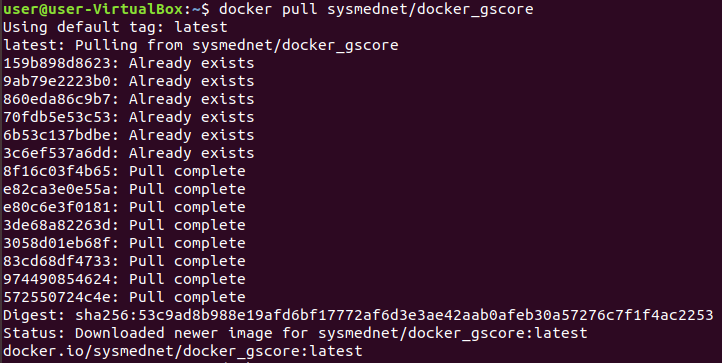
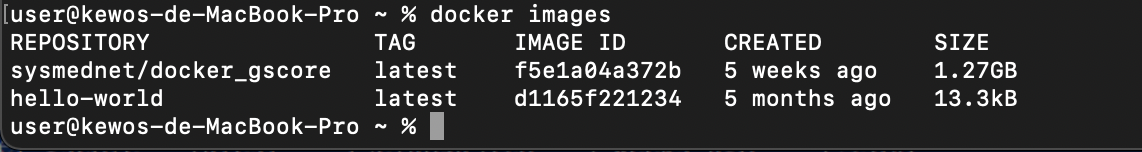
4. Confirm that you have downloaded the Docker image by following command.
$ docker images

5. Execute the docker image of Gscore through the following command.
$ docker run -it -v [path/to/Input folder]:/app/io sysmednet/docker_gscore bash

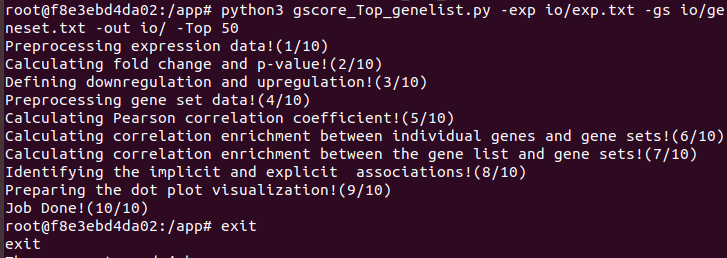
6. Execute the Gscore analysis in Docker container through the following command.
$ python3 gscore_Top_genelist.py -exp io/exp.txt -gs io/geneset.txt -out io/ -Top 50
$ exit
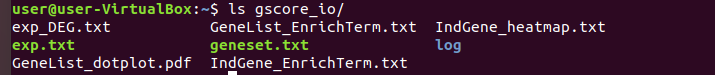
7. Output files of Gscore analysis will appear in the created folder.
$ ls [path/to/Input folder]
$ sudo apt install docker.io
2. Move to folder of /home/[username] and create a folder to store input and output data.
$ cd ~
$ mkdir gscore_io
Put the input file to the folder. Example download
Input expression data file format demo:
Input gene set list file format demo:
3. Download Gscore Docker images from Docker hub by following command.
$ docker pull sysmednet/docker_gscore
4. Confirm that you have downloaded the Docker image by following command.
$ docker images
5. Execute the docker image of Gscore through the following command.
$ docker run -it -v [path/to/Input folder]:/app/io sysmednet/docker_gscore bash
6. Execute the Gscore analysis in Docker container through the following command.
$ python3 gscore_Top_genelist.py -exp io/exp.txt -gs io/geneset.txt -out io/ -Top 50
$ exit
7. Output files of Gscore analysis will appear in the created folder.
$ ls [path/to/Input folder]
Windows 10
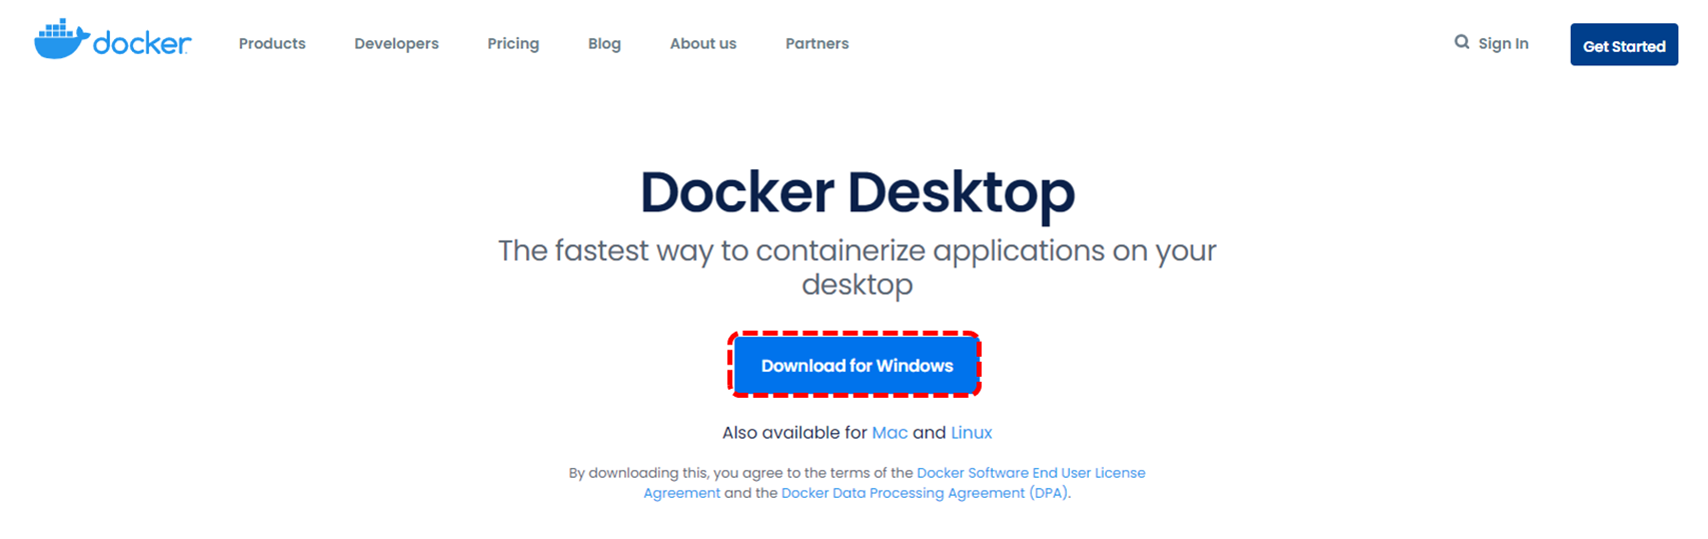
1. Download
Docker Desktop.
2. Open "Docker Desktop Installer.exe" and follow the instruction to setup.
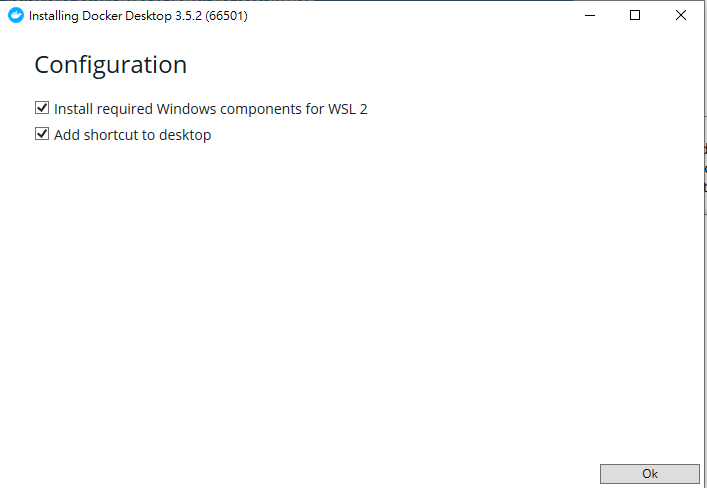
Tip: Docker Desktop may need to install WSL2 and enable virtualization.
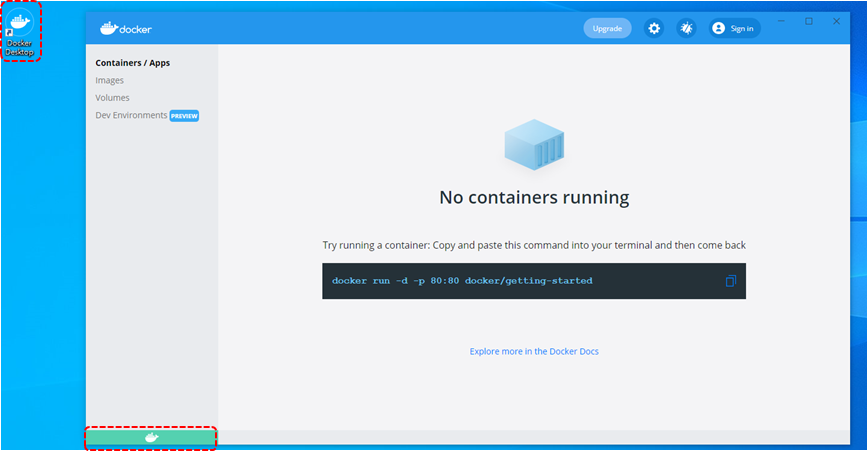
3. If the docker service has been successfully turned on, a green indicator will appear on the bottom-left in the Docker app.
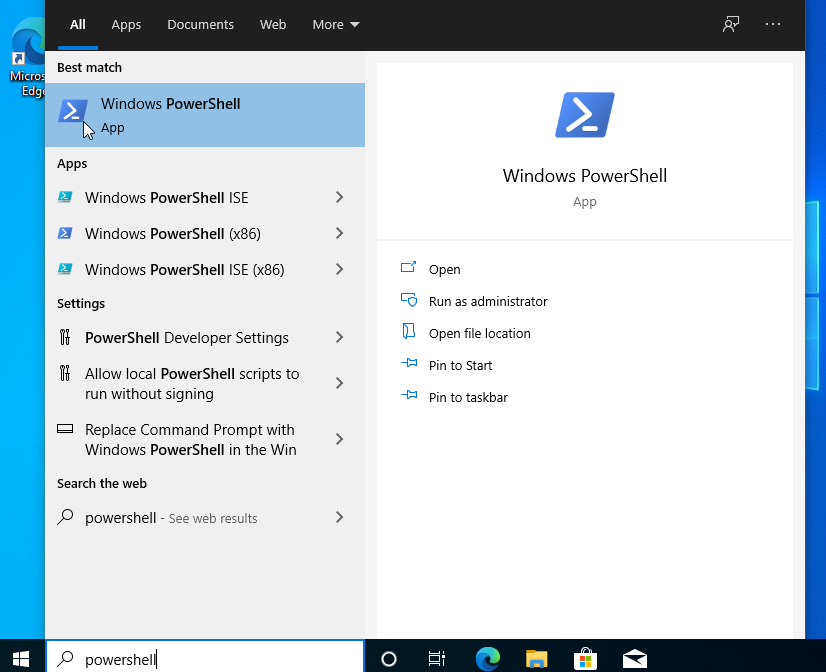
4. Open "Windows PowerShell" by using search bar.
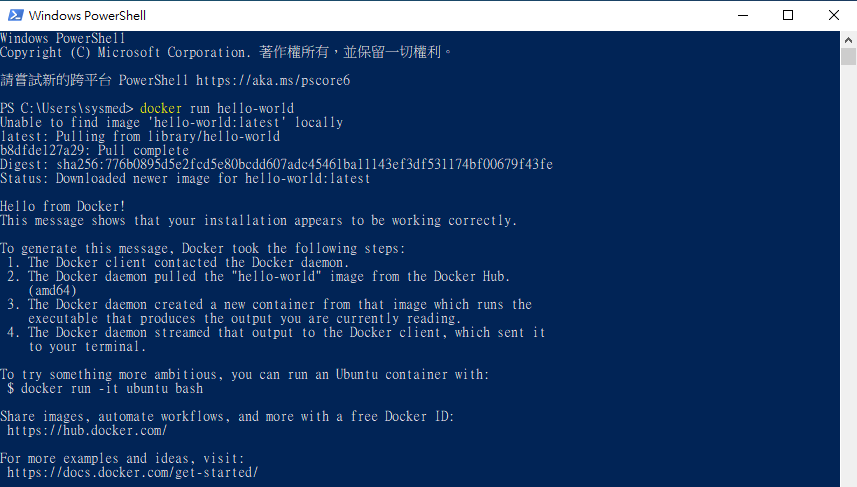
5. Test Docker by following command.
$ docker run hello-world
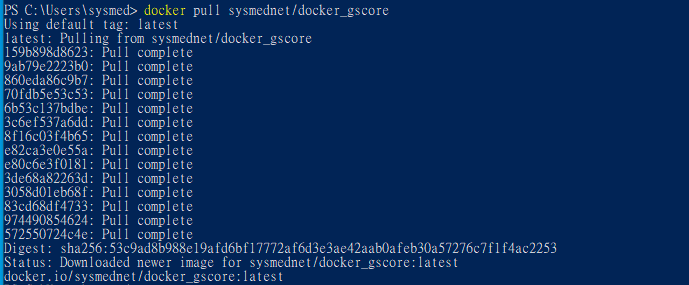
6. Download Gscore Docker images from Docker hub by following command.
$ docker pull sysmednet/docker_gscore
7. Confirm that you have downloaded the Docker image by following command.
$ docker images

Create a folder (i.e., Input folder) to put the data to be analyzed. Example download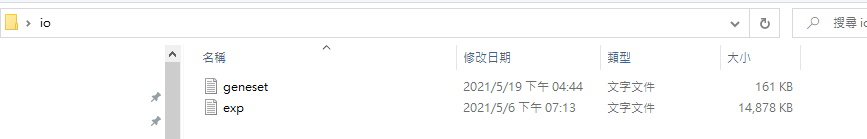
Input expression data file format demo:
Input gene set list file format demo:
9. Run the Docker image of Gscore through the following command.
$ docker run -it -v [path/to/Input folder]:/app/io sysmednet/docker_gscore bash
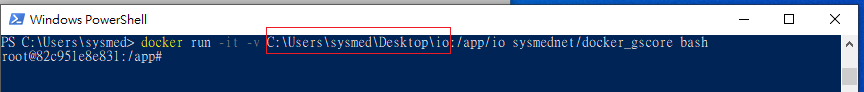
Tip: to get [path/to/Input folder], please directly type it or drag the folder to PowerShell (without “ ” or ‘ ’) as follows.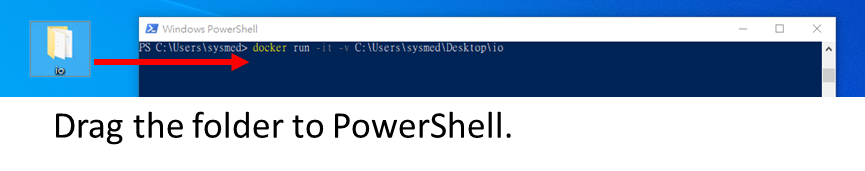
10. Execute the Gscore analysis in Docker container through the following command.
$ python3 gscore_Top_genelist.py -exp io/exp.txt -gs io/geneset.txt -out io/ -Top 50
$ exit
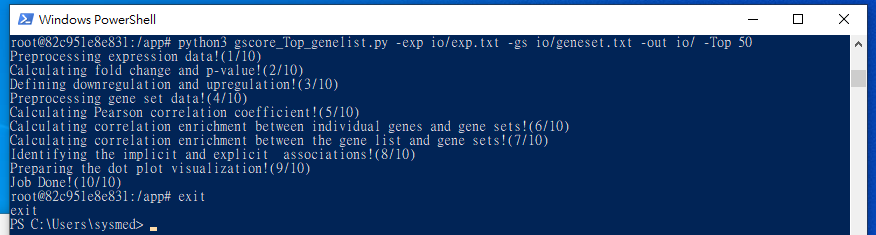
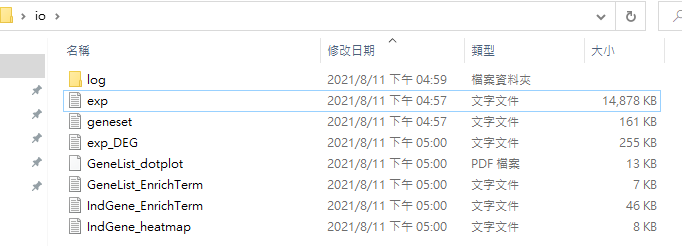
11. Output files of Gscore analysis will appear in the created folder.
2. Open "Docker Desktop Installer.exe" and follow the instruction to setup.
Tip: Docker Desktop may need to install WSL2 and enable virtualization.
3. If the docker service has been successfully turned on, a green indicator will appear on the bottom-left in the Docker app.
4. Open "Windows PowerShell" by using search bar.
5. Test Docker by following command.
$ docker run hello-world
6. Download Gscore Docker images from Docker hub by following command.
$ docker pull sysmednet/docker_gscore
7. Confirm that you have downloaded the Docker image by following command.
$ docker images
Create a folder (i.e., Input folder) to put the data to be analyzed. Example download
Input expression data file format demo:
Input gene set list file format demo:
9. Run the Docker image of Gscore through the following command.
$ docker run -it -v [path/to/Input folder]:/app/io sysmednet/docker_gscore bash
Tip: to get [path/to/Input folder], please directly type it or drag the folder to PowerShell (without “ ” or ‘ ’) as follows.
10. Execute the Gscore analysis in Docker container through the following command.
$ python3 gscore_Top_genelist.py -exp io/exp.txt -gs io/geneset.txt -out io/ -Top 50
$ exit
11. Output files of Gscore analysis will appear in the created folder.
Mac OS
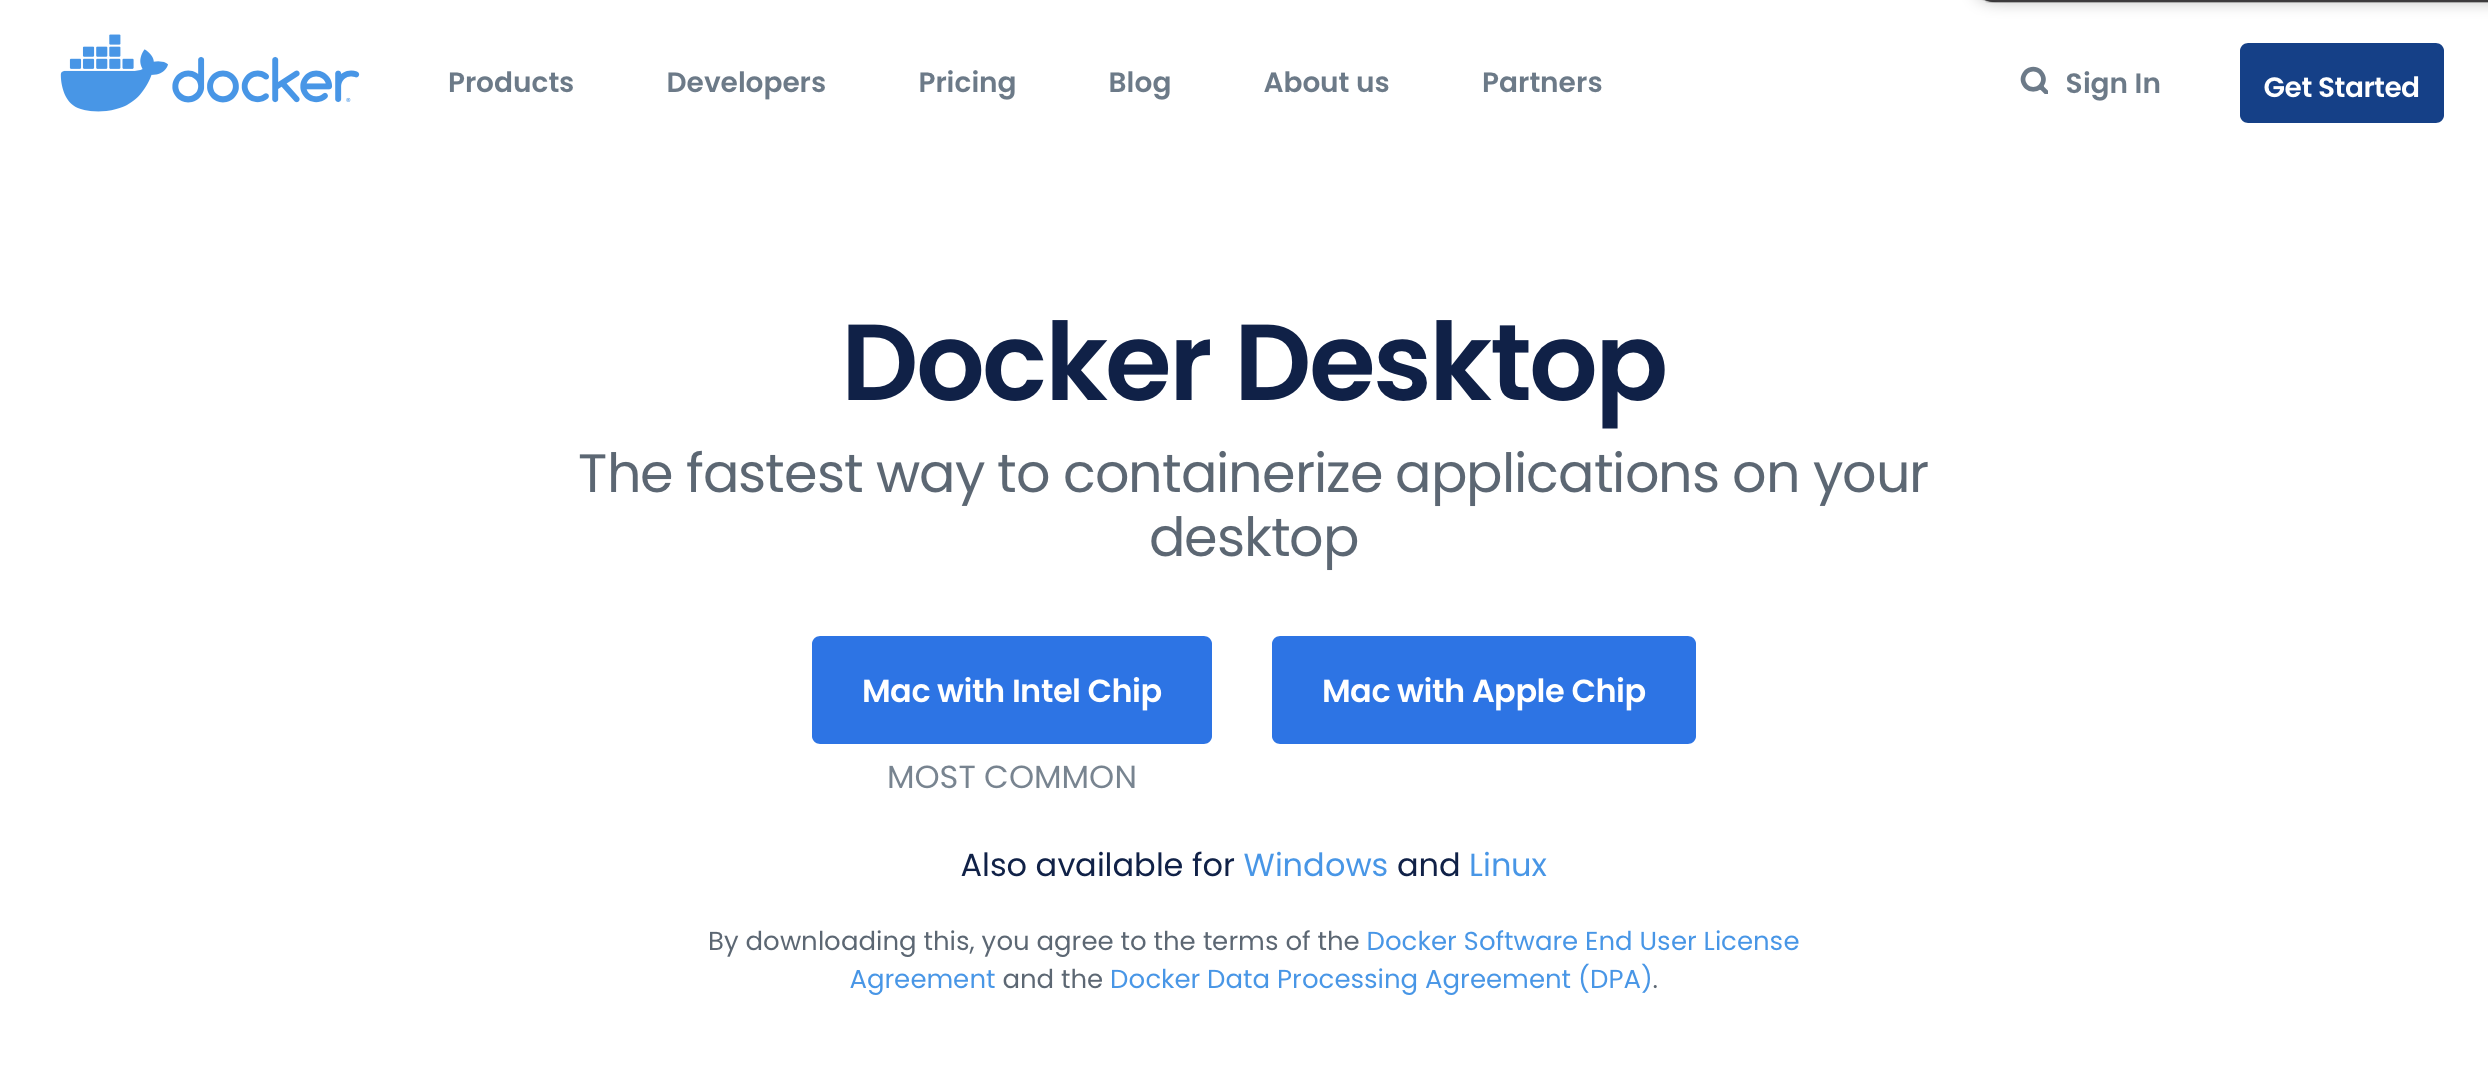
1. Download
Docker Desktop.
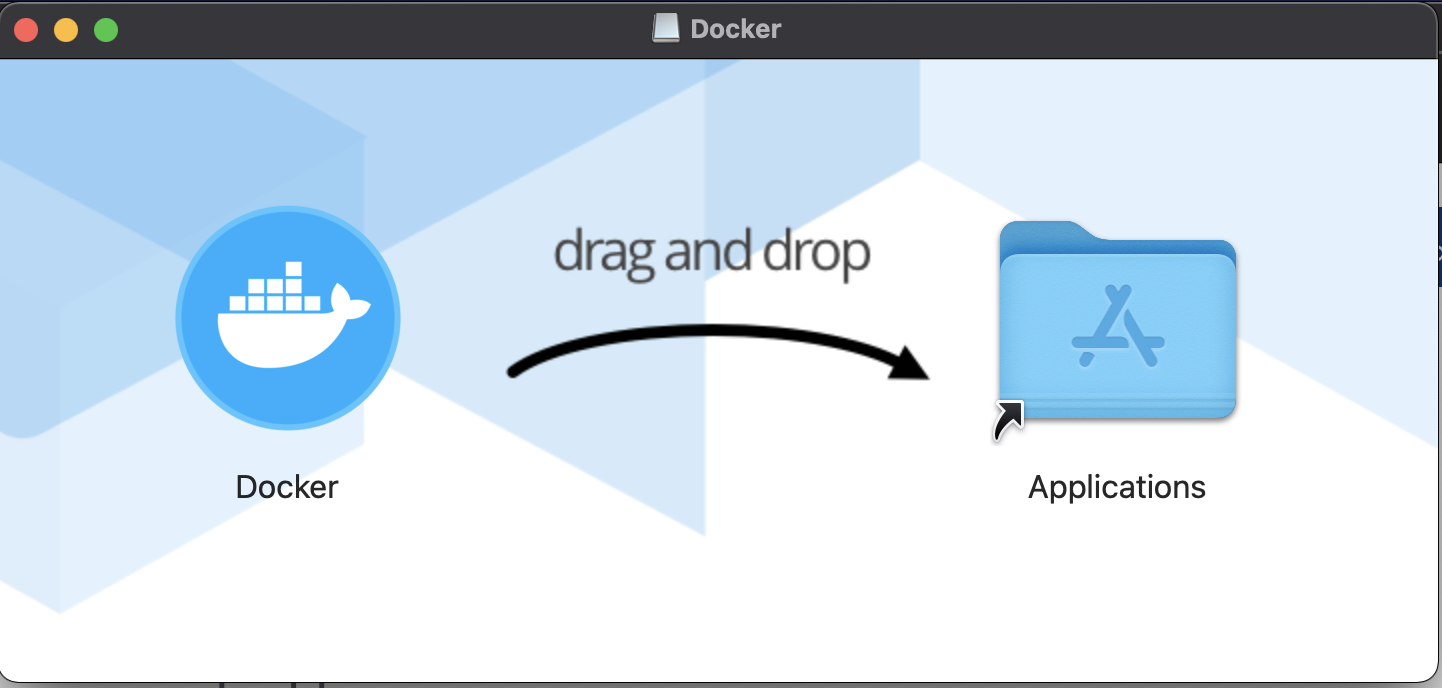
2. Open "Docker.dmg" and follow the instruction to setup.
3. If the docker service has been successfully turned on, a green indicator will appear on the bottom-left in the Docker app.
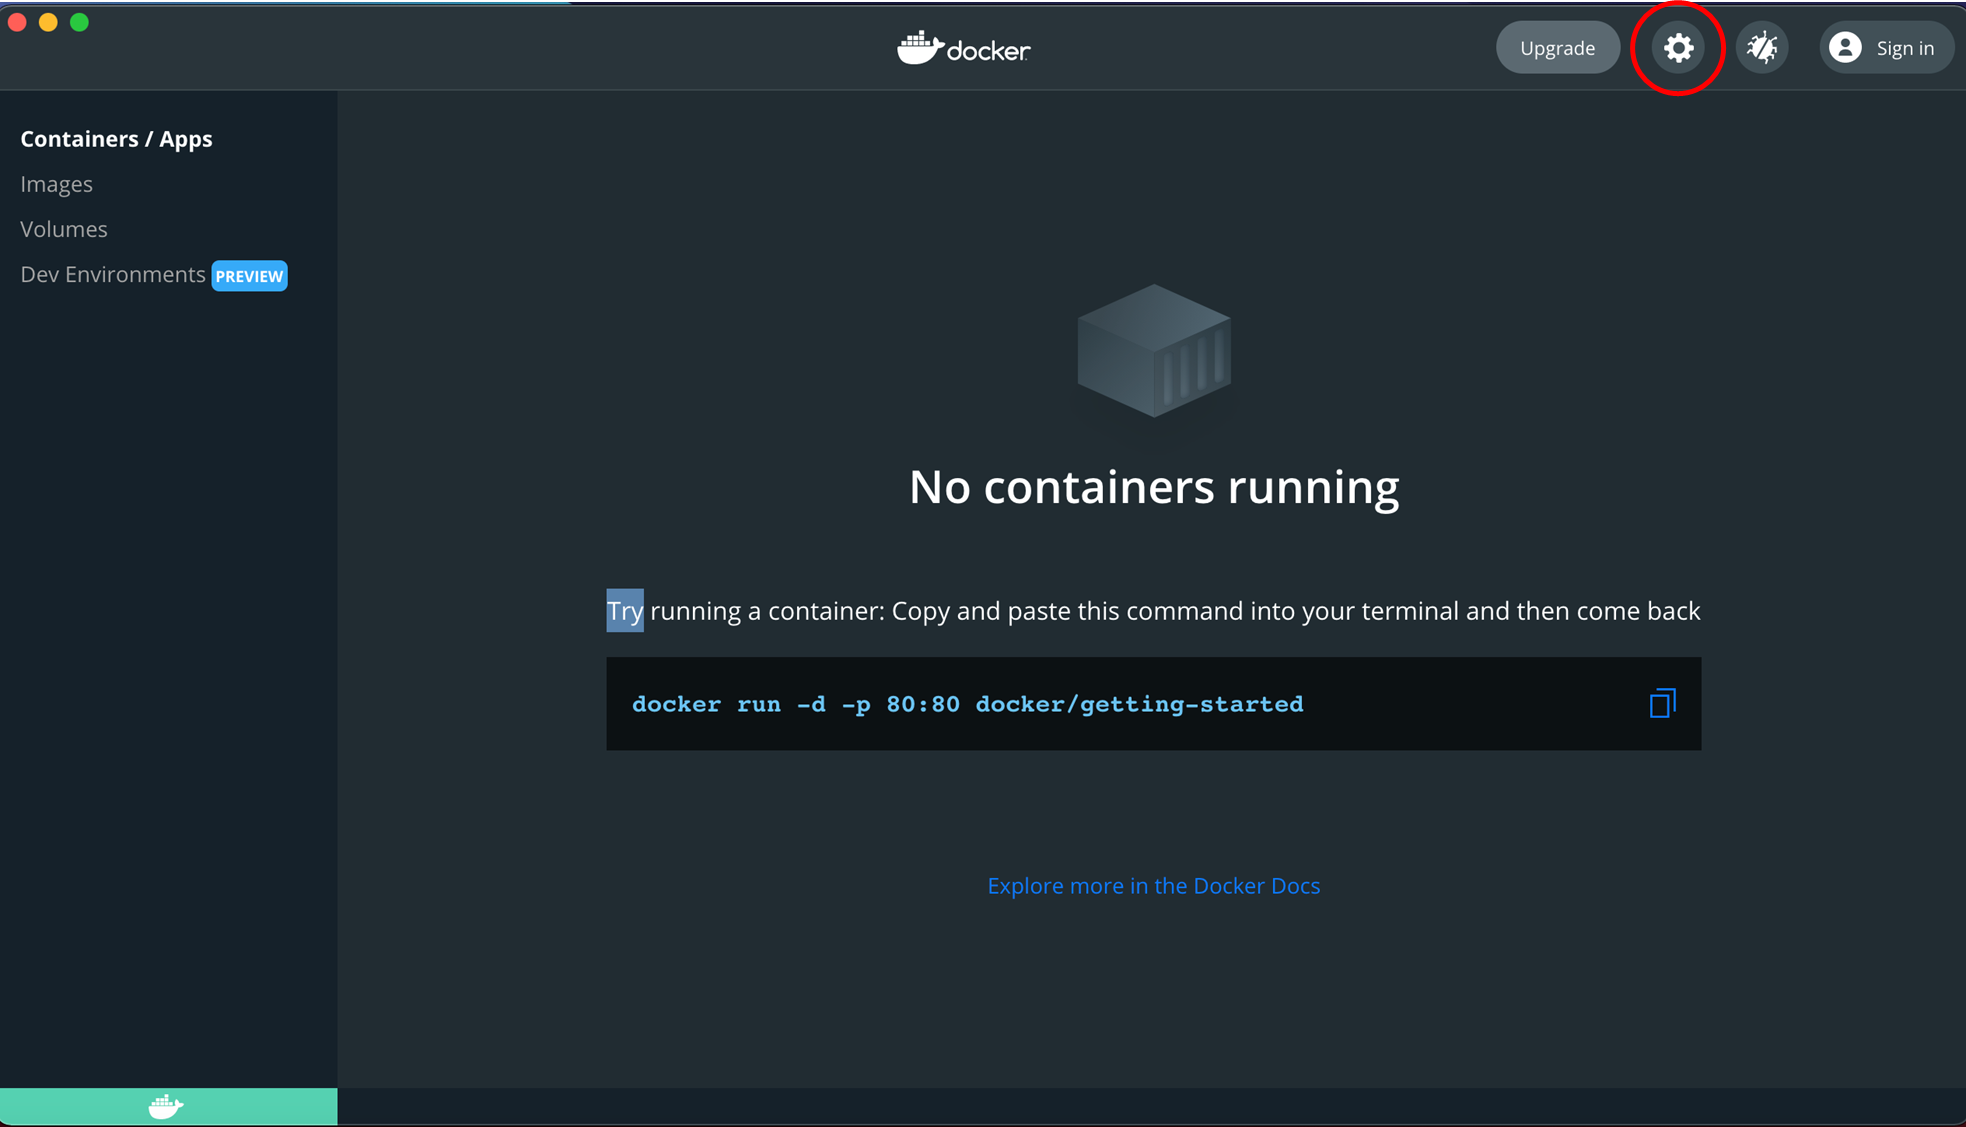
Go to Preference / Resources / Advanced. Adjust the resources with rolling bar (recommend at least 4G RAM). Press"Apply & Restart". Waiting for the Docker to restart.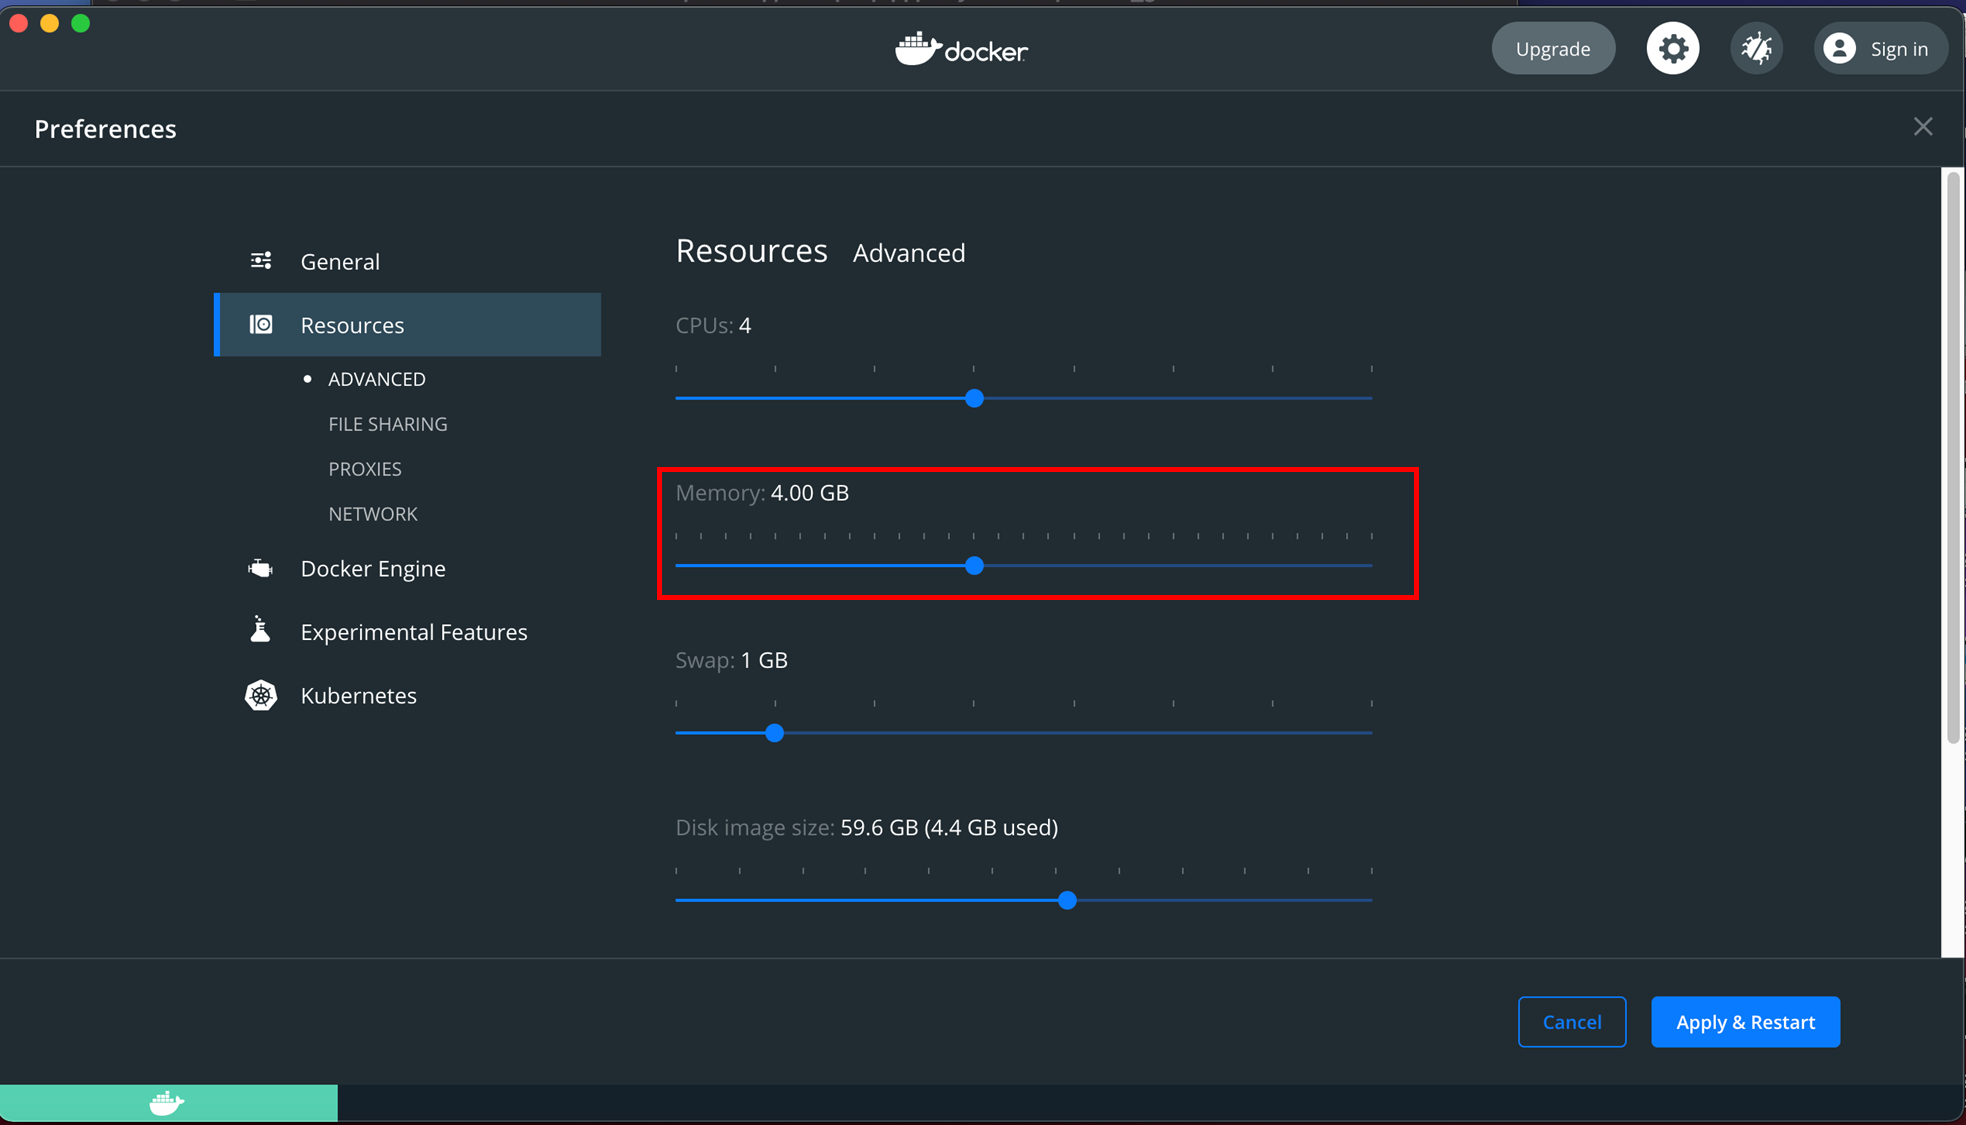
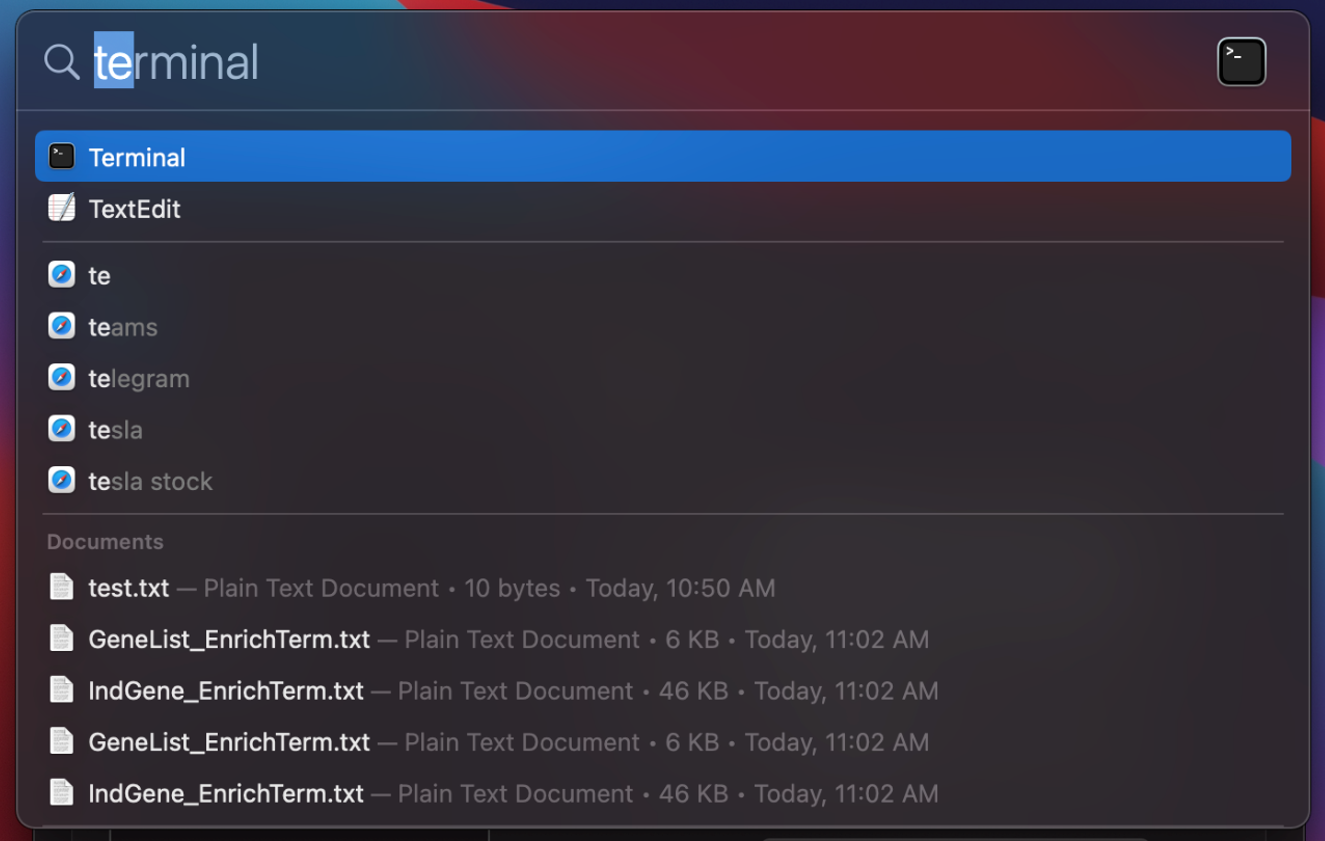
4. Open "Terminal" by using search bar.
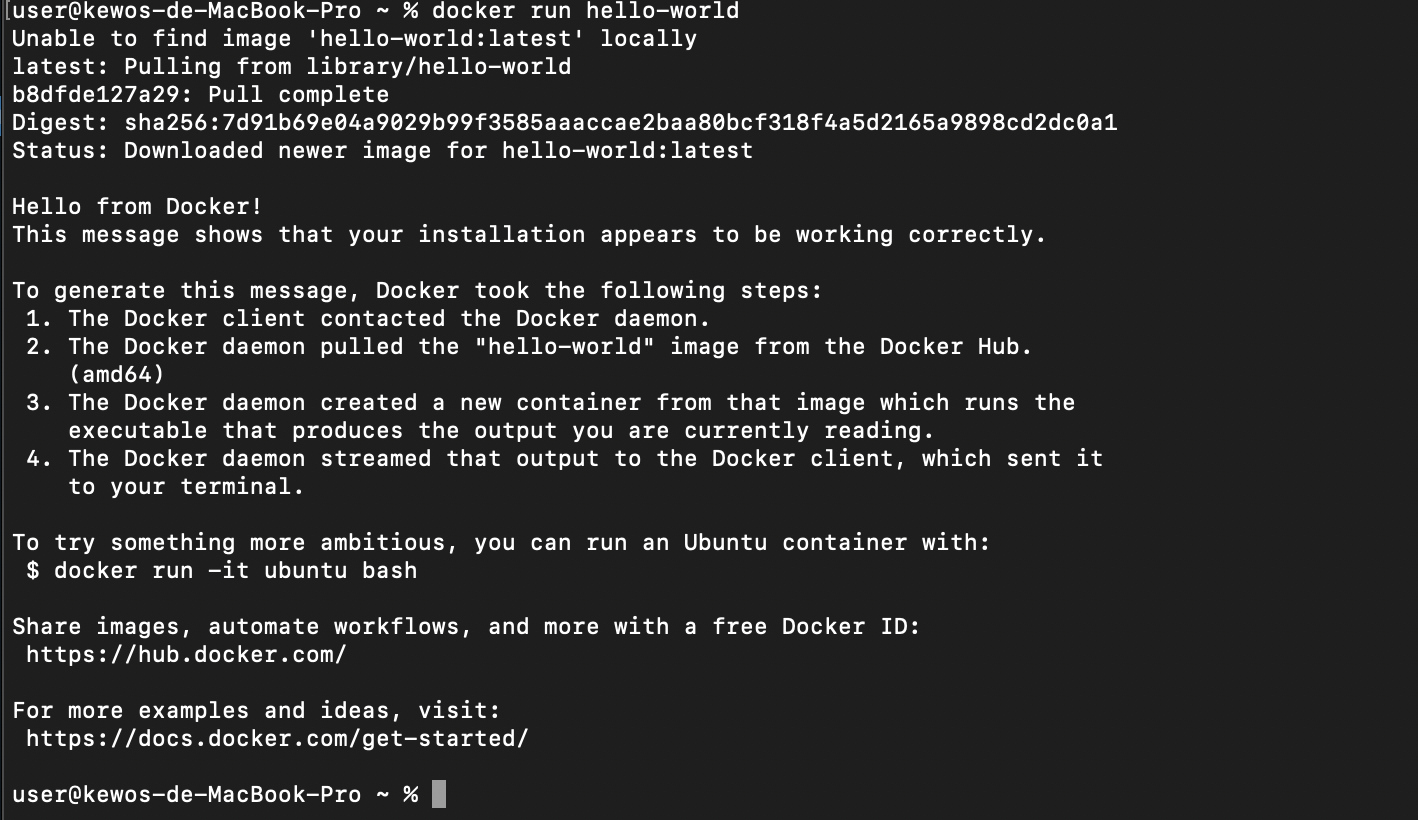
5. Test Docker by following command.
$ docker run hello-world
6. Download Gscore Docker images from Docker hub by following command.
$ docker pull sysmednet/docker_gscore
7. Confirm that you have downloaded the Docker image by following command.
$ docker images
Create a folder (i.e., Input folder) to put the data to be analyzed. Example download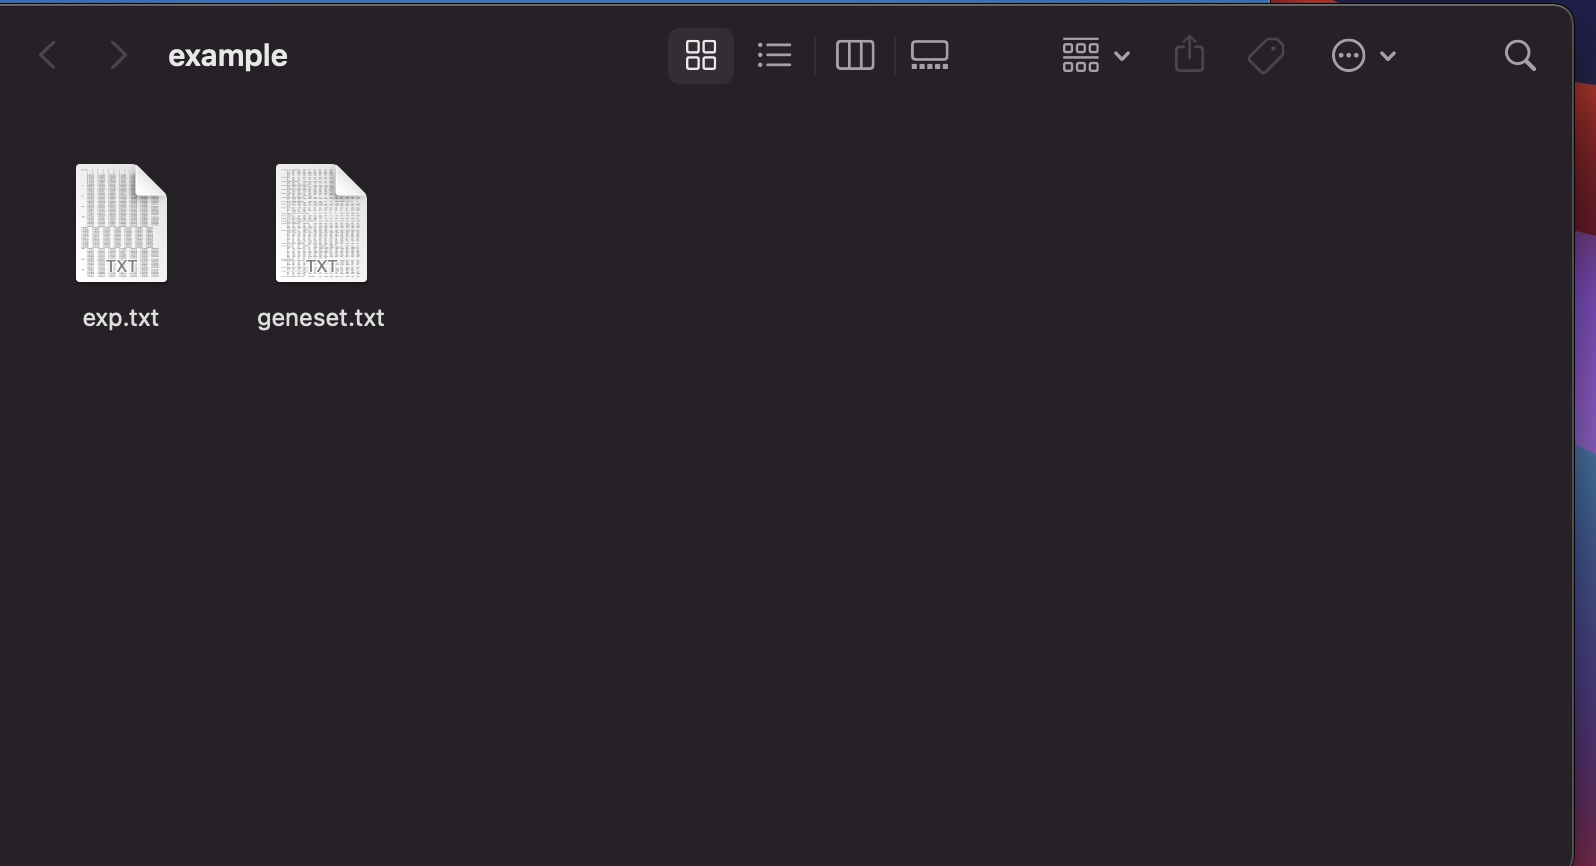
Input expression data file format demo:
Input gene set list file format demo:
9. Run the Docker image of Gscore through the following command.
$ docker run -it -v [path/to/Input folder]:/app/io sysmednet/docker_gscore bash
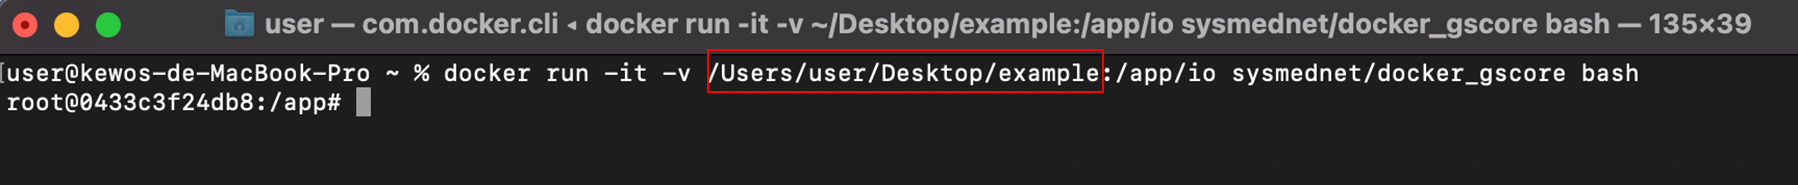
Tip: to get [path/to/Input folder], please directly type it or drag the folder to Terminal (without “ ” or ‘ ’) as follows.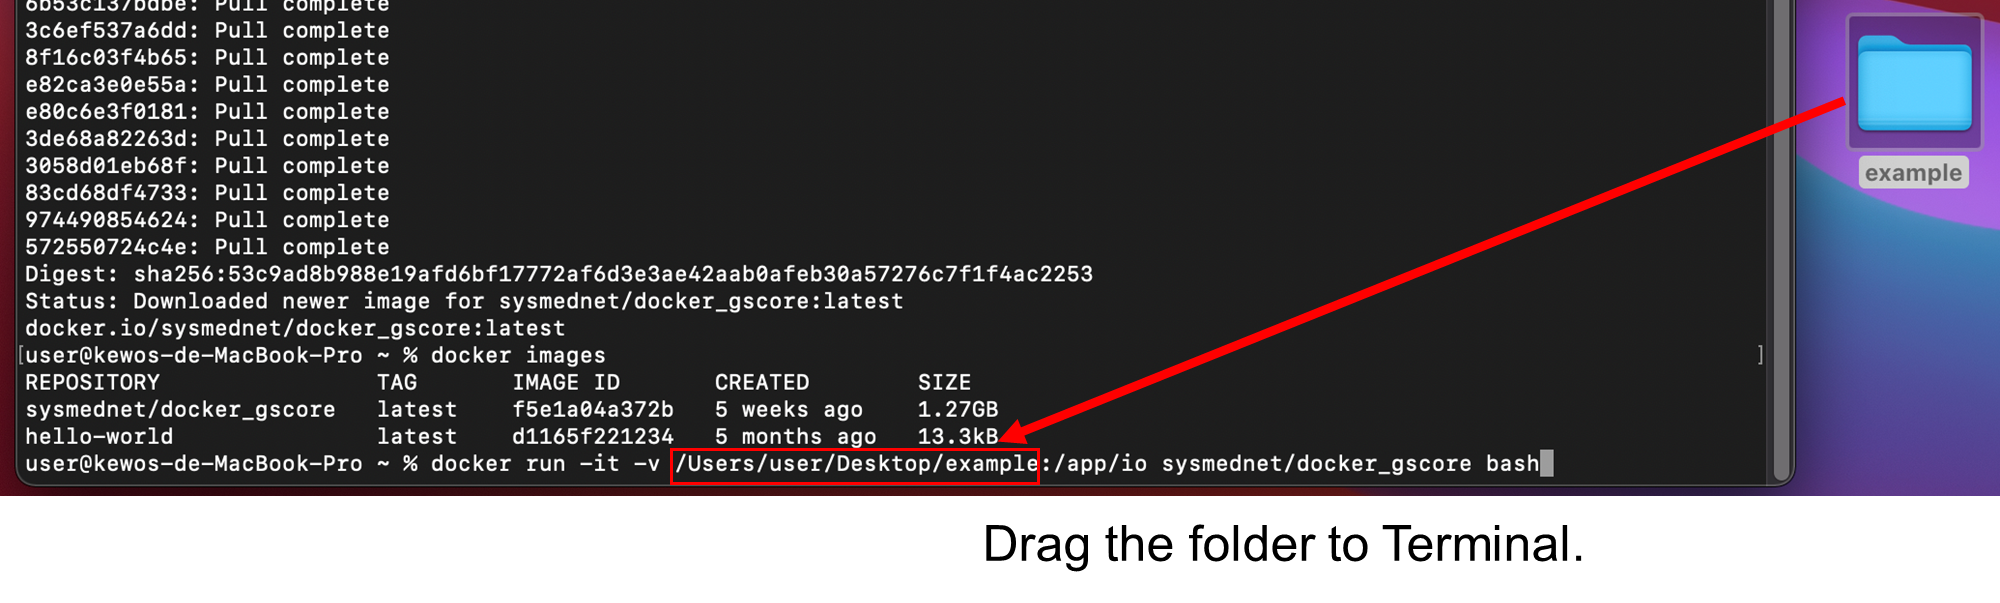
10. Execute the Gscore analysis in Docker container through the following command.
$ python3 gscore_Top_genelist.py -exp io/exp.txt -gs io/geneset.txt -out io/ -Top 50
$ exit
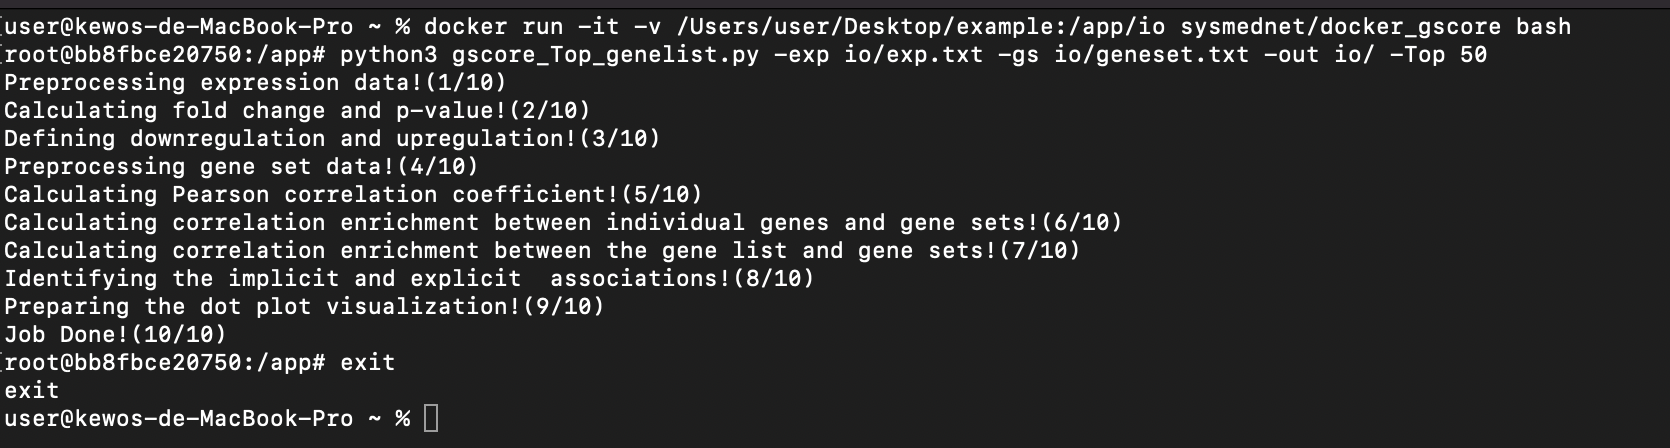
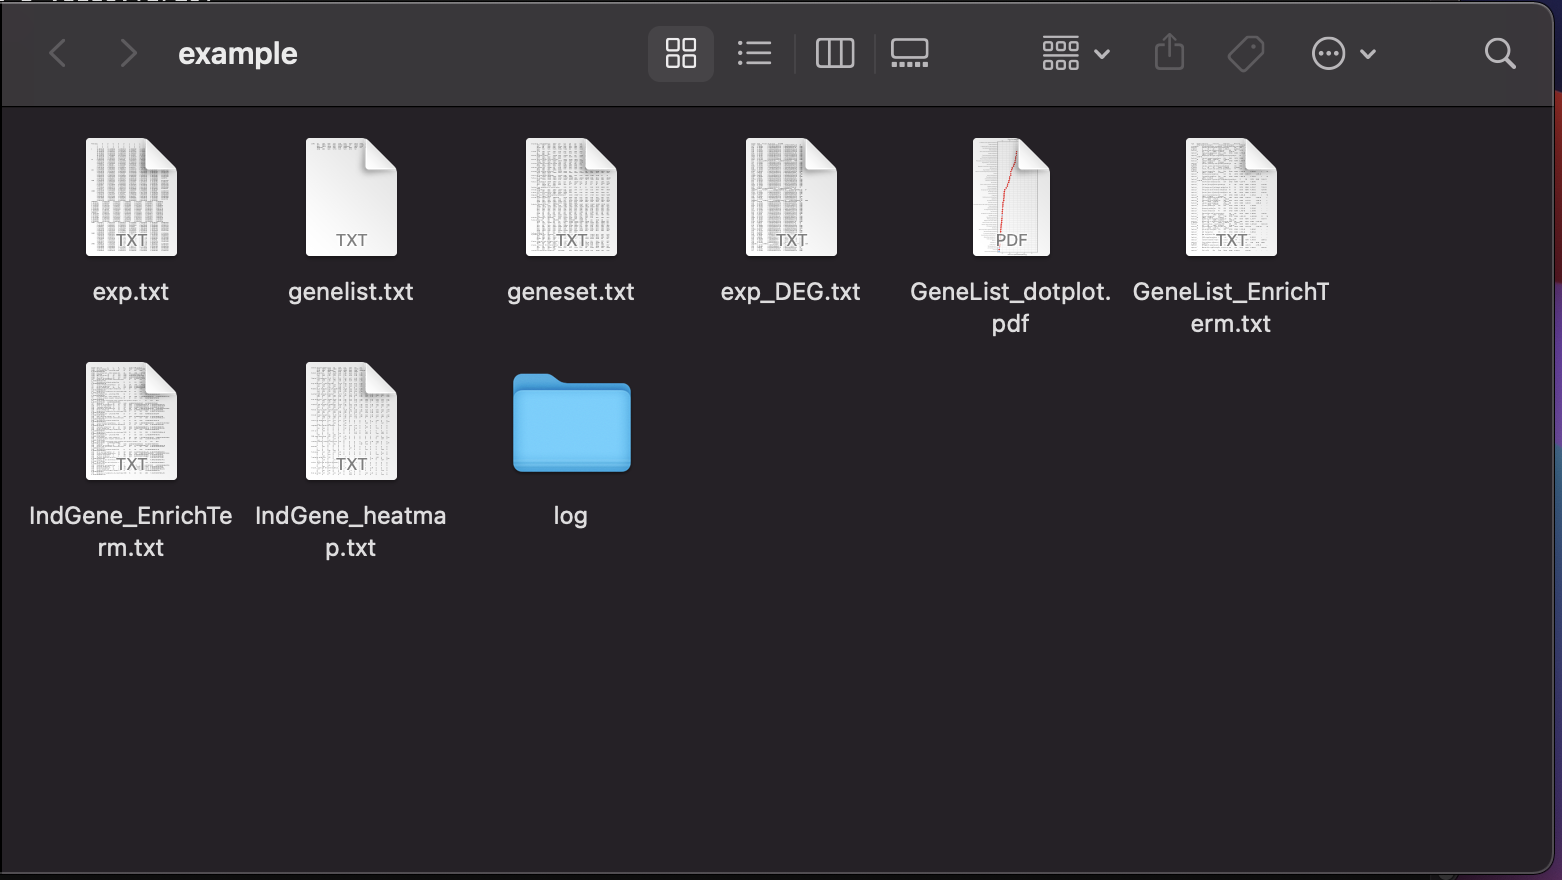
11. Output files of Gscore analysis will appear in the created folder.
2. Open "Docker.dmg" and follow the instruction to setup.
3. If the docker service has been successfully turned on, a green indicator will appear on the bottom-left in the Docker app.
Go to Preference / Resources / Advanced. Adjust the resources with rolling bar (recommend at least 4G RAM). Press"Apply & Restart". Waiting for the Docker to restart.
4. Open "Terminal" by using search bar.
5. Test Docker by following command.
$ docker run hello-world
6. Download Gscore Docker images from Docker hub by following command.
$ docker pull sysmednet/docker_gscore
7. Confirm that you have downloaded the Docker image by following command.
$ docker images
Create a folder (i.e., Input folder) to put the data to be analyzed. Example download
Input expression data file format demo:
Input gene set list file format demo:
9. Run the Docker image of Gscore through the following command.
$ docker run -it -v [path/to/Input folder]:/app/io sysmednet/docker_gscore bash
Tip: to get [path/to/Input folder], please directly type it or drag the folder to Terminal (without “ ” or ‘ ’) as follows.
10. Execute the Gscore analysis in Docker container through the following command.
$ python3 gscore_Top_genelist.py -exp io/exp.txt -gs io/geneset.txt -out io/ -Top 50
$ exit
11. Output files of Gscore analysis will appear in the created folder.
Reference Manual
(1) gscore_Top_genelist.py
Gene set correlation enrichment analysis (Gscore) of gene list ranked by |log2| fold change. Given a list of genes and a category of gene sets. This Python scirption will return the Gscore analysis.Usage
$ python3 gscore_Top_genelist.py -exp example/exp.txt -gs example/geneset.txt -out example/ -Top 50| Argument | Variable | Description | Default value |
|---|---|---|---|
| -h | help | Get help for any of the Gscore commands | NA |
| -exp | EXP_PATH | Input file of the expression data | ./example/exp.txt |
| -gs | GENESET_PATH | Input file of gene set list | ./example/geneset.txt |
| -out | OUTPUT_PATH | Output path of analysis results of Gscore | ./example |
| -log2 | LOG2_TRANS | Apply log2 transformation to the data [1=Yes or 0=No] | 0 |
| -FC | DEG_LOG_FC | Criterion of |Fold Change(FC)| for determining differentially expressed genes(DEGs)[ranging from 1.3 to 5] | 1.5 |
| -pval | DEG_P_VAL | Criterion of adjusted p-value for determining DEGs [ranging from 0.00001 to 0.05] | 0.05 |
| -Top | TOP_DEG | The maximum number of DEGs, ranked by |log2 FC|, are selected in enrichment analysis | 100 |
| -PCC | PCC_THRESHOLD | Criterion of Pearson correlation coefficient for determining co-expressed DEG pairs between the query gene list and gene sets [ranging from 0.1 to 1.0] | 0.5 |
| -id_filter | INDGENE_FILTER | Define the enriched gene sets for each individual DEG by using FDR q-value or raw p-value [1=FDR q-value or 2=raw p-value] | 1 |
| -p_qval | INDGENE_P_Q_VAL | Criterion of FDR q-value(or raw p-value)for determining the enriched gene sets of each individual DEG [ranging from 0.00001 to 1.0] | 0.05 |
| -gl_filter | GENELIST_FILTER | Define the enriched gene sets for the query DEG list by using adjusted p-value or raw p-value [1=adj. p-value or 2=raw p-value] | 1 |
| -adjp | GENELIST_ADJP_VAL | Criterion of adjusted p-value(or raw p-value)for determining the enriched gene sets of the DEG list [ranging from 0.00001 to 1.0] | 0.05 |
| -id_co | INDGENE_COEXP | Output of the co-expressed DEG pairs between each individual DEG and the gene sets [1=Yes or 0=No; default=0] | 0 |
| -gl_co | GENELIST_COEXP | Output of the co-expressed DEG pairs between the query DEG list and the gene sets [1=Yes or 0=No; default=0] | 0 |
(2) gscore_user_defined_genelist.py
Gene set correlation enrichment analysis (Gscore) of gene list provided by the user. Given a list of genes and a category of gene sets. This Python scirption will return the Gscore analysis.Usage
$ python3 gscore_user_defined_genelist.py -exp example/exp.txt -gs example/geneset.txt -gl example/genelist.txt -out example/| Argument | Variable | Description | Default value |
|---|---|---|---|
| -h | help | Get help for any of the Gscore commands | NA |
| -exp | EXP_PATH | Input file of the expression data | ./example/exp.txt |
| -gs | GENESET_PATH | Input file of gene set list | ./example/geneset.txt |
| -gl | GENELIST_PATH | Input file of user-defined gene list | ./example/genelist.txt |
| -out | OUTPUT_PATH | Output path of analysis results of Gscore | ./example |
| -log2 | LOG2_TRANS | Apply log2 transformation to the data [1=Yes or 0=No] | 0 |
| -FC | DEG_LOG_FC | Criterion of |Fold Change(FC)| for determining differentially expressed genes(DEGs)[ranging from 1.3 to 5] | 1.5 |
| -pval | DEG_P_VAL | Criterion of adjusted p-value for determining DEGs [ranging from 0.00001 to 0.05] | 0.05 |
| -PCC | PCC_THRESHOLD | Criterion of Pearson correlation coefficient for determining co-expressed DEG pairs between the query gene list and gene sets [ranging from 0.1 to 1.0] | 0.5 |
| -id_filter | INDGENE_FILTER | Define the enriched gene sets for each individual DEG by using FDR q-value or raw p-value [1=FDR q-value or 2=raw p-value] | 1 |
| -p_qval | INDGENE_P_Q_VAL | Criterion of FDR q-value(or raw p-value)for determining the enriched gene sets of each individual DEG [ranging from 0.00001 to 1.0] | 0.05 |
| -gl_filter | GENELIST_FILTER | Define the enriched gene sets for the query DEG list by using adjusted p-value or raw p-value [1=adj. p-value or 2=raw p-value] | 1 |
| -adjp | GENELIST_ADJP_VAL | Criterion of adjusted p-value(or raw p-value)for determining the enriched gene sets of the DEG list [ranging from 0.00001 to 1.0] | 0.05 |
| -id_co | INDGENE_COEXP | Output of the co-expressed DEG pairs between each individual DEG and the gene sets [1=Yes or 0=No; default=0] | 0 |
| -gl_co | GENELIST_COEXP | Output of the co-expressed DEG pairs between the query DEG list and the gene sets [1=Yes or 0=No; default=0] | 0 |
(3) gscore_individual_DEG.py
Gene set correlation enrichment analysis (Gscore) of individual DEG ranked by |log2| fold change. Given a DEG and a category of gene sets. This Python scirption will return the Gscore analysis.Usage
$ python3 gscore_individual_DEG.py -exp example/exp.txt -gs example/geneset.txt -out example/ -Top 50| Argument | Variable | Description | Default value |
|---|---|---|---|
| -h | help | Get help for any of the Gscore commands | NA |
| -exp | EXP_PATH | Input file of the expression data | ./example/exp.txt |
| -gs | GENESET_PATH | Input file of gene set list | ./example/geneset.txt |
| -out | OUTPUT_PATH | Output path of analysis results of Gscore | ./example |
| -log2 | LOG2_TRANS | Apply log2 transformation to the data [1=Yes or 0=No] | 0 |
| -FC | DEG_LOG_FC | Criterion of |Fold Change(FC)| for determining differentially expressed genes(DEGs)[ranging from 1.3 to 5] | 1.5 |
| -pval | DEG_P_VAL | Criterion of adjusted p-value for determining DEGs [ranging from 0.00001 to 0.05] | 0.05 |
| -Top | TOP_DEG | The maximum number of DEGs, ranked by |log2 FC|, are selected in enrichment analysis | 100 |
| -PCC | PCC_THRESHOLD | Criterion of Pearson correlation coefficient for determining co-expressed DEG pairs between the query gene list and gene sets [ranging from 0.1 to 1.0] | 0.5 |
| -id_filter | INDGENE_FILTER | Define the enriched gene sets for each individual DEG by using FDR q-value or raw p-value [1=FDR q-value or 2=raw p-value] | 1 |
| -p_qval | INDGENE_P_Q_VAL | Criterion of FDR q-value(or raw p-value)for determining the enriched gene sets of each individual DEG [ranging from 0.00001 to 1.0] | 0.05 |
| -id_co | INDGENE_COEXP | Output of the co-expressed DEG pairs between each individual DEG and the gene sets [1=Yes or 0=No; default=0] | 0 |