Summary of Gscore online tool
Gscore tool is useful for identifying the coexpressed gene pairs between (1) individual gene in the query DEG list and all the DEGs of a certain gene set in the selected collection to determine its association significance; (2) the query DEG list and all the DEGs of a certain gene set in the selected collection to determine its association significance.
For data privacy, we suggest the users MUST delete the sample header and label the sample phenotypes by "0" and "1" which represents "control" and "case", respectively. The Gscore tool also provides an option of user-defined feature ID to let the users upload and analyze the customized gene expression dataset. Please note that our server preserves the data of each query session for only 24 hours.
Quick start
1. Input:
-
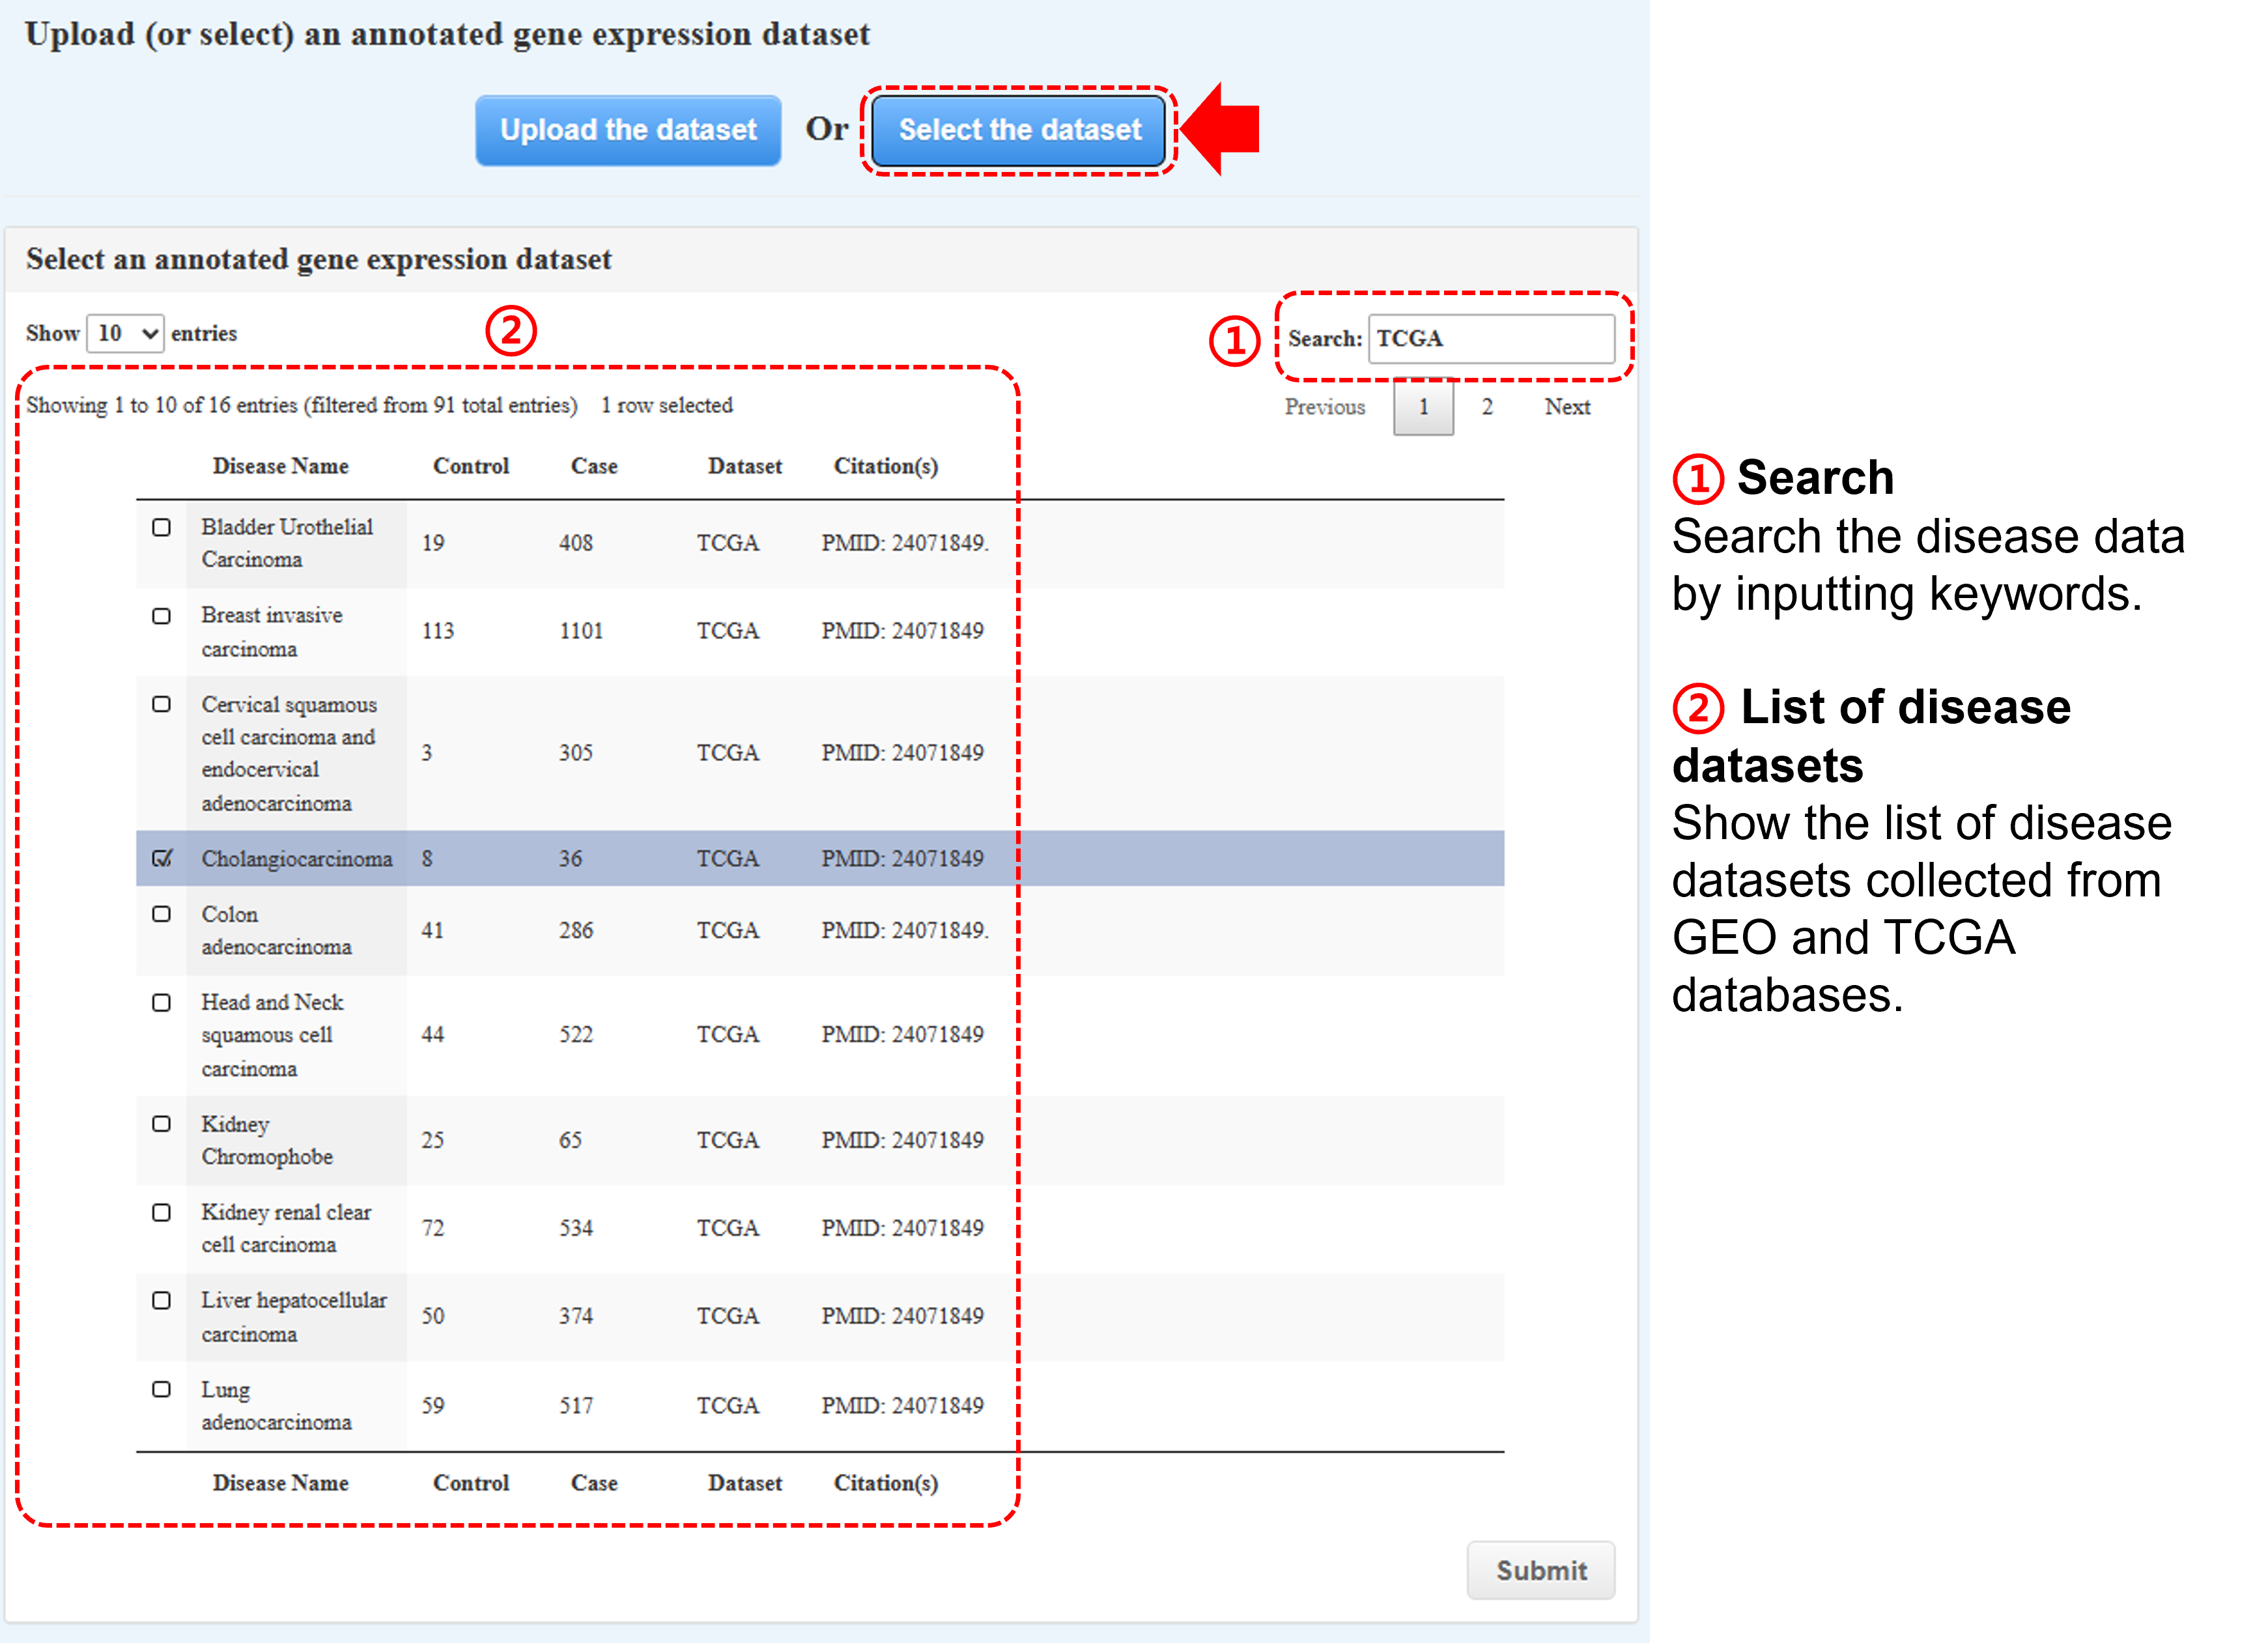
Upload your prepared gene expression dataset or Select one of our formatted datasets (used in our study) collected from several public databases.
e.g.,
Gene Expression Omnibus (GEO)
The Cancer Genome Atlas (TCGA)
-
Choose the DEGs of interest (≥3) from the result of differentially expressed gene (DEG) list
-
Upload a collection of your prepared gene sets or
Select one of the collections of formatted gene sets collected from several public databases (monthly update).
e.g.,
Kyoto Encyclopedia of Genes and Genome (KEGG)
Reactome Pathway Database (Reactome)
Gene Ontology (GO)
DisGeNET - a database of gene-disease associations
Curated drug–target set from the DrugBank, ChEMBL, and BindingDB databases
The Molecular Signatures Database (MSigDB)
Complex Portal - Human Complex
CORUM - the comprehensive resource of mammalian protein complexes
2. Output:
- A dot plot, table, and network displaying the p value/FDR q value to determine whether a DEG list is significantly associated with the certain gene sets. The FDR q value was used for multiple hypothesis testing using Benjamini–Hochberg method.
-
A heatmap, table, and network showing the p value/FDR q value to determine whether an individual DEG is significantly associated with the certain gene sets. The FDR q value was used for multiple hypothesis testing using Benjamini–Hochberg method.
Preparation of Data (Input)
1. Gene expression dataset with phenotypic annotations (i.e., 0:Control; 1:Case)
-
(a) Upload your prepared dataset

- The samples are labeled with 0 (control) or 1 (case).
- The number of case samples is suggested to be ≥ 5 (minimum is 3) for the correlation calculation.
- The number of control samples must be ≥ 3 for the statistical analysis of determining the DEGs.
- Gscore tool accepts a variety of data value types, including logged and unlogged data of RNA-seq (e.g., RPKM, FPKM, and TPM) or microarray. Since the limma package expects data values to be in log space, please upload the profiles with values of log2 transformation, or select "Yes" in the option of "Apply log2 transformation to the data" to perform a log2 transformation (default: No).
-
(b) Or select one of our formatted datasets (used in our study) collected from
several public databases (monthly update)
- Gscore tool provides an interactive table interface (i.e., DataTables plug-in for jQuery), including keyword search and value sorting.
2. Choose query genes of interest from the result of the differentially expressed gene (DEG) list
-
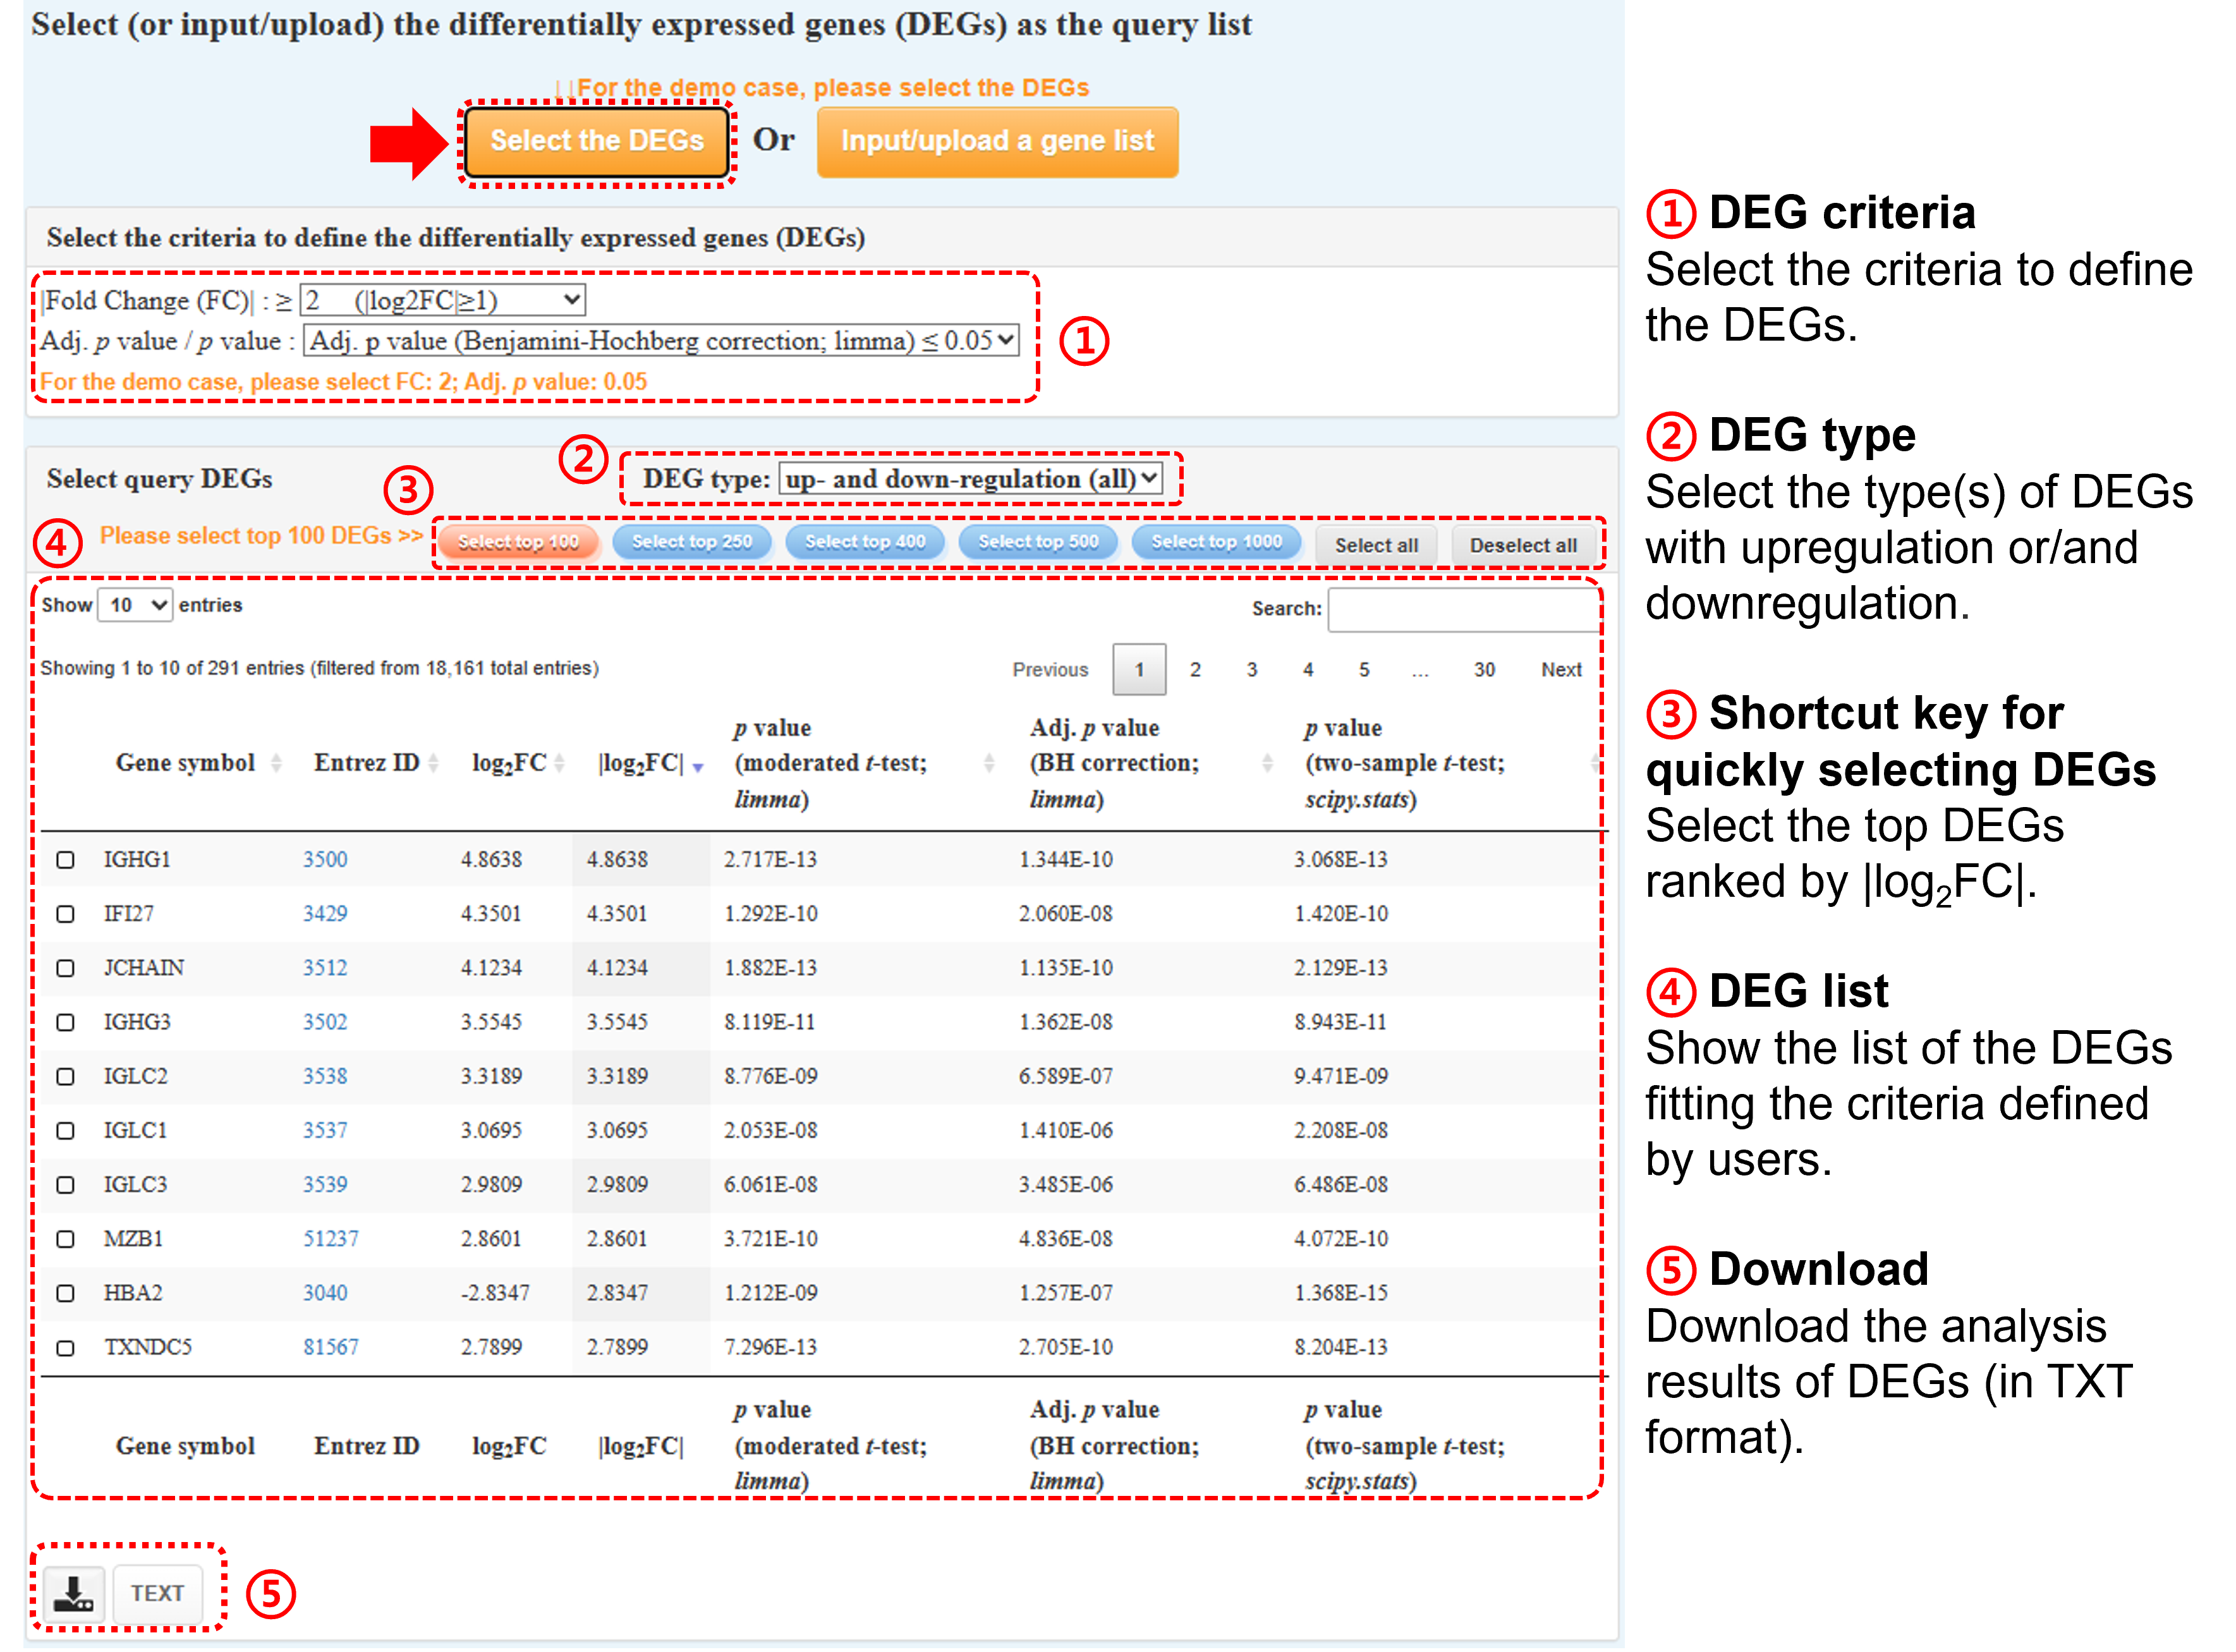
(a) Select the DEGs via the interactive table interface
-
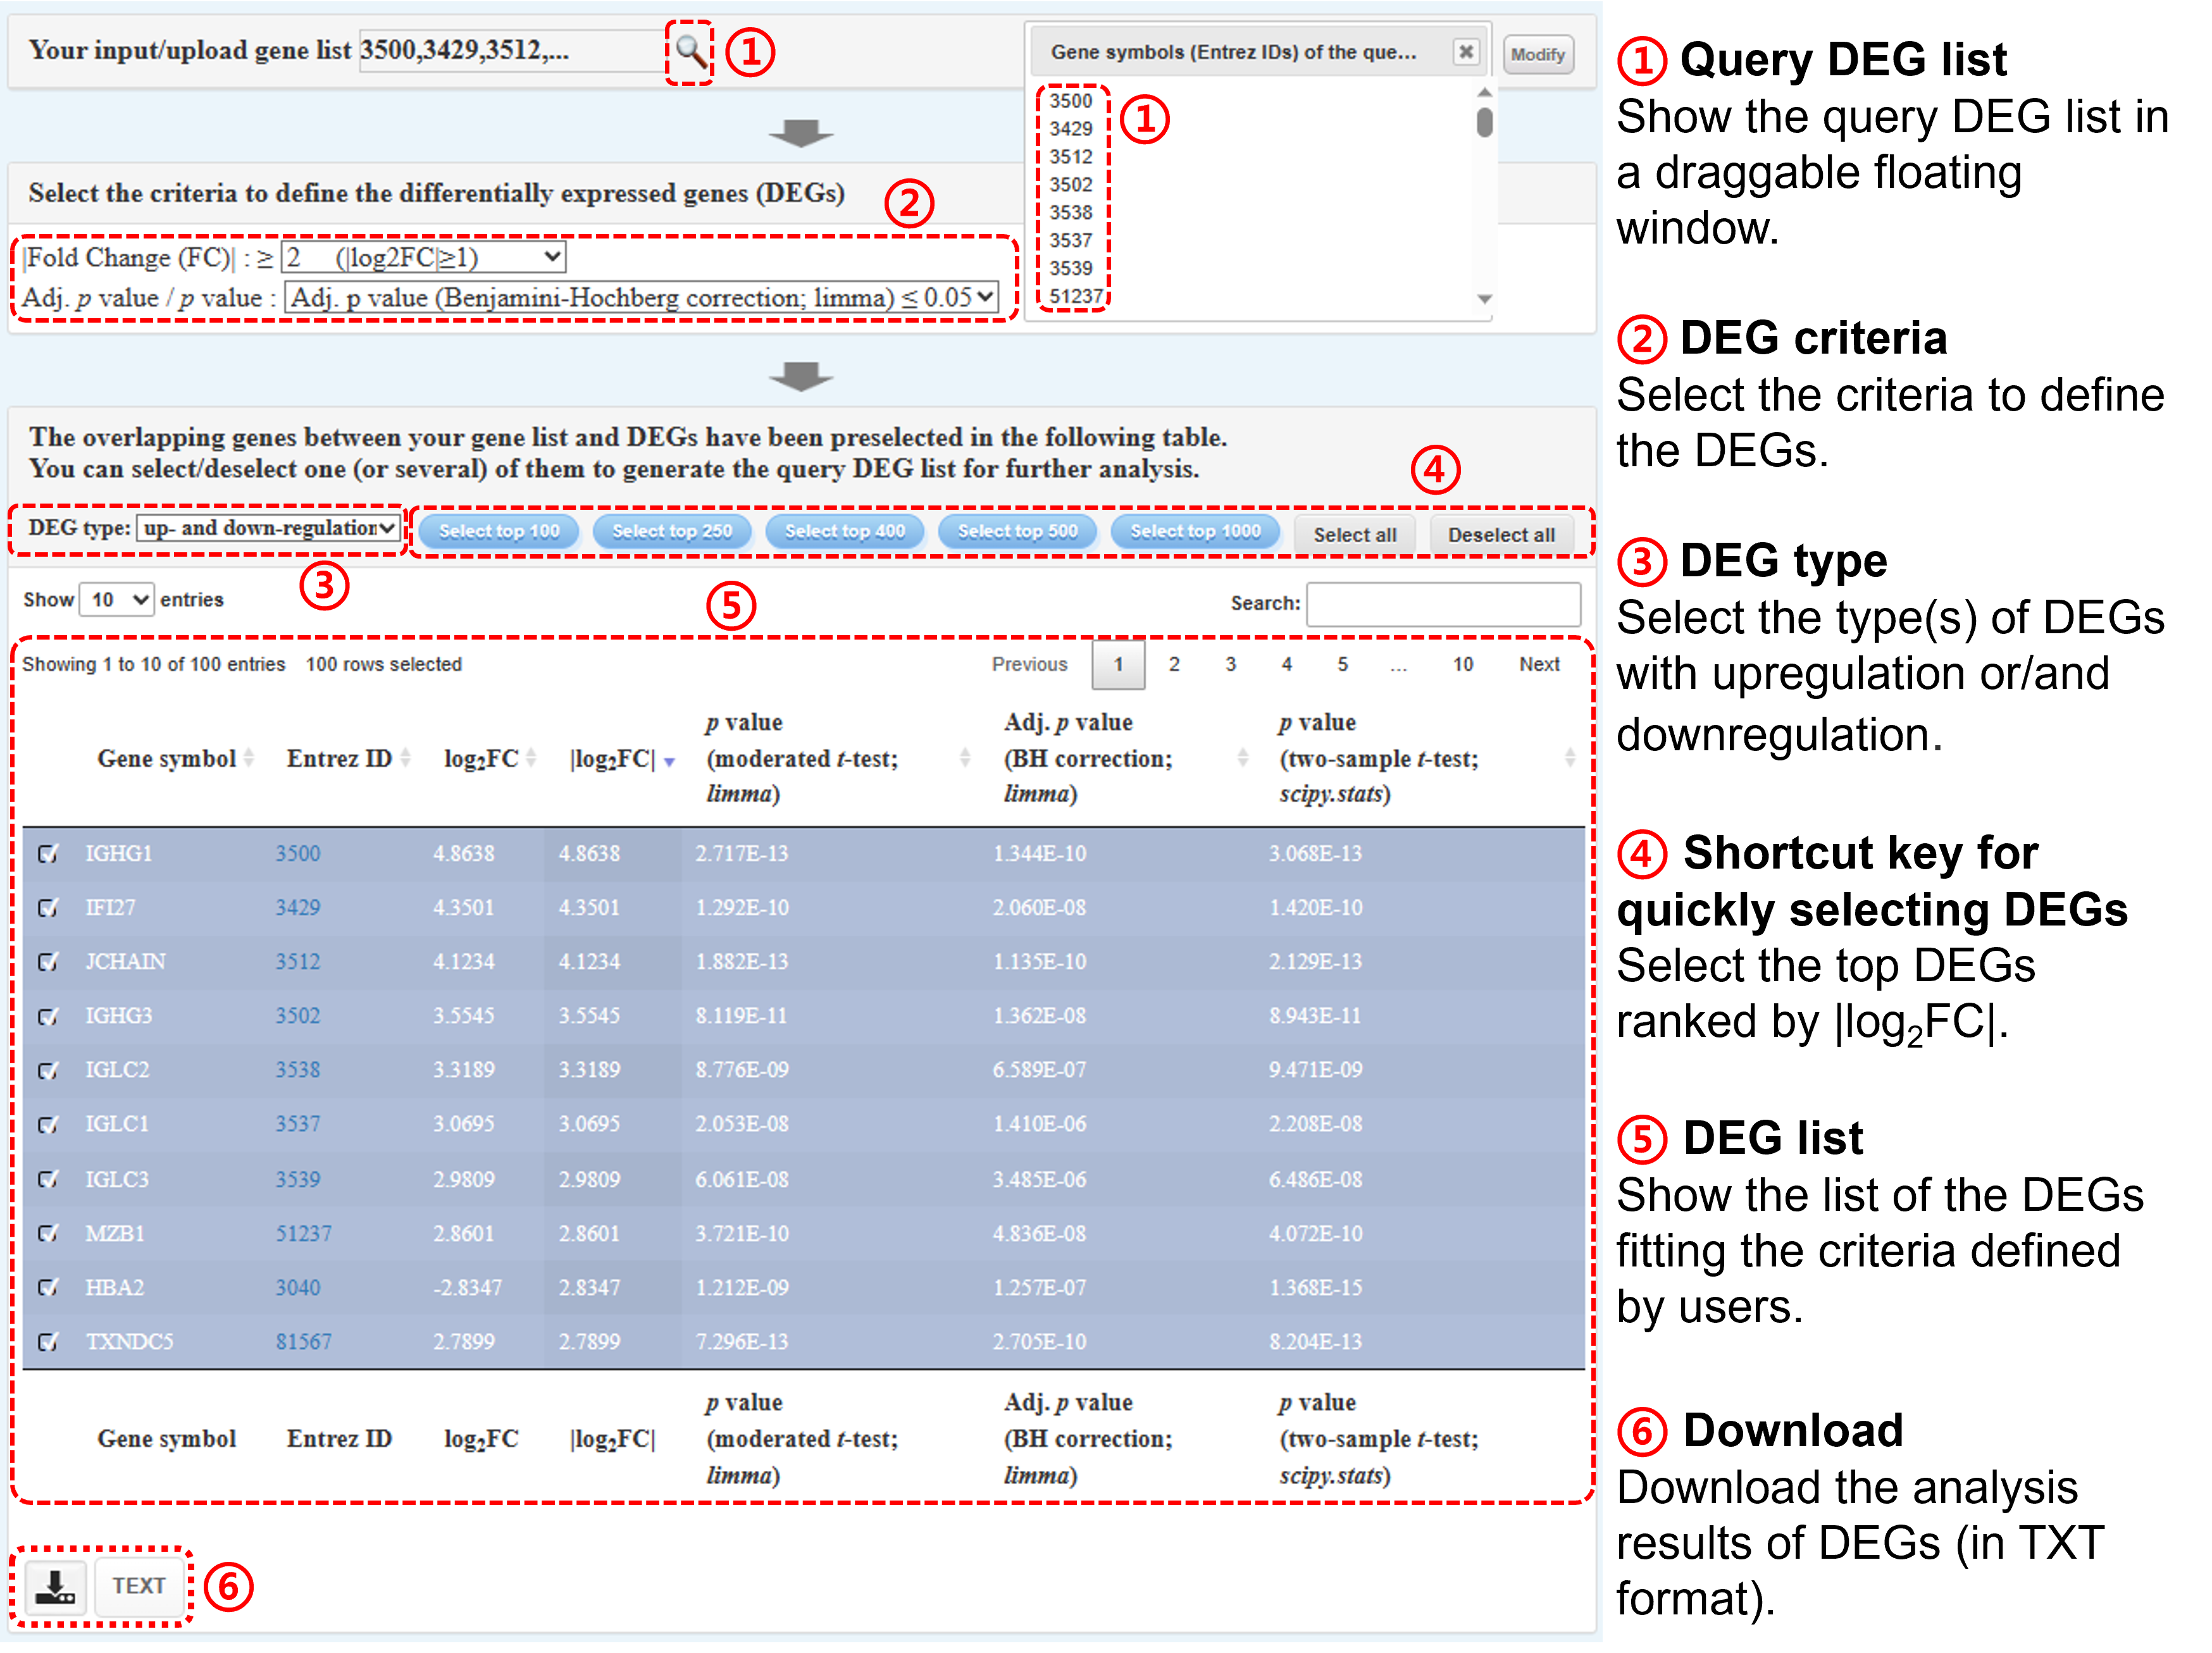
Step ①: Please select the criteria to define the differentially expressed genes (DEGs), including fold change (FC) and adj. p value / p value. Please note that the log2FC
values in the following table have been rounded off to the 4th decimal place, and the raw values are provided in the download file.
Step ②-④: Please select DEGs of interest as the query DEG list. The number of selected DEGs must be ≥3. Gscore tool provides the functional buttons for selecting top-ranked gene lists.
Step ⑤: You can download the analysis results of DEGs (in TXT format) via click the TEXT button.
-
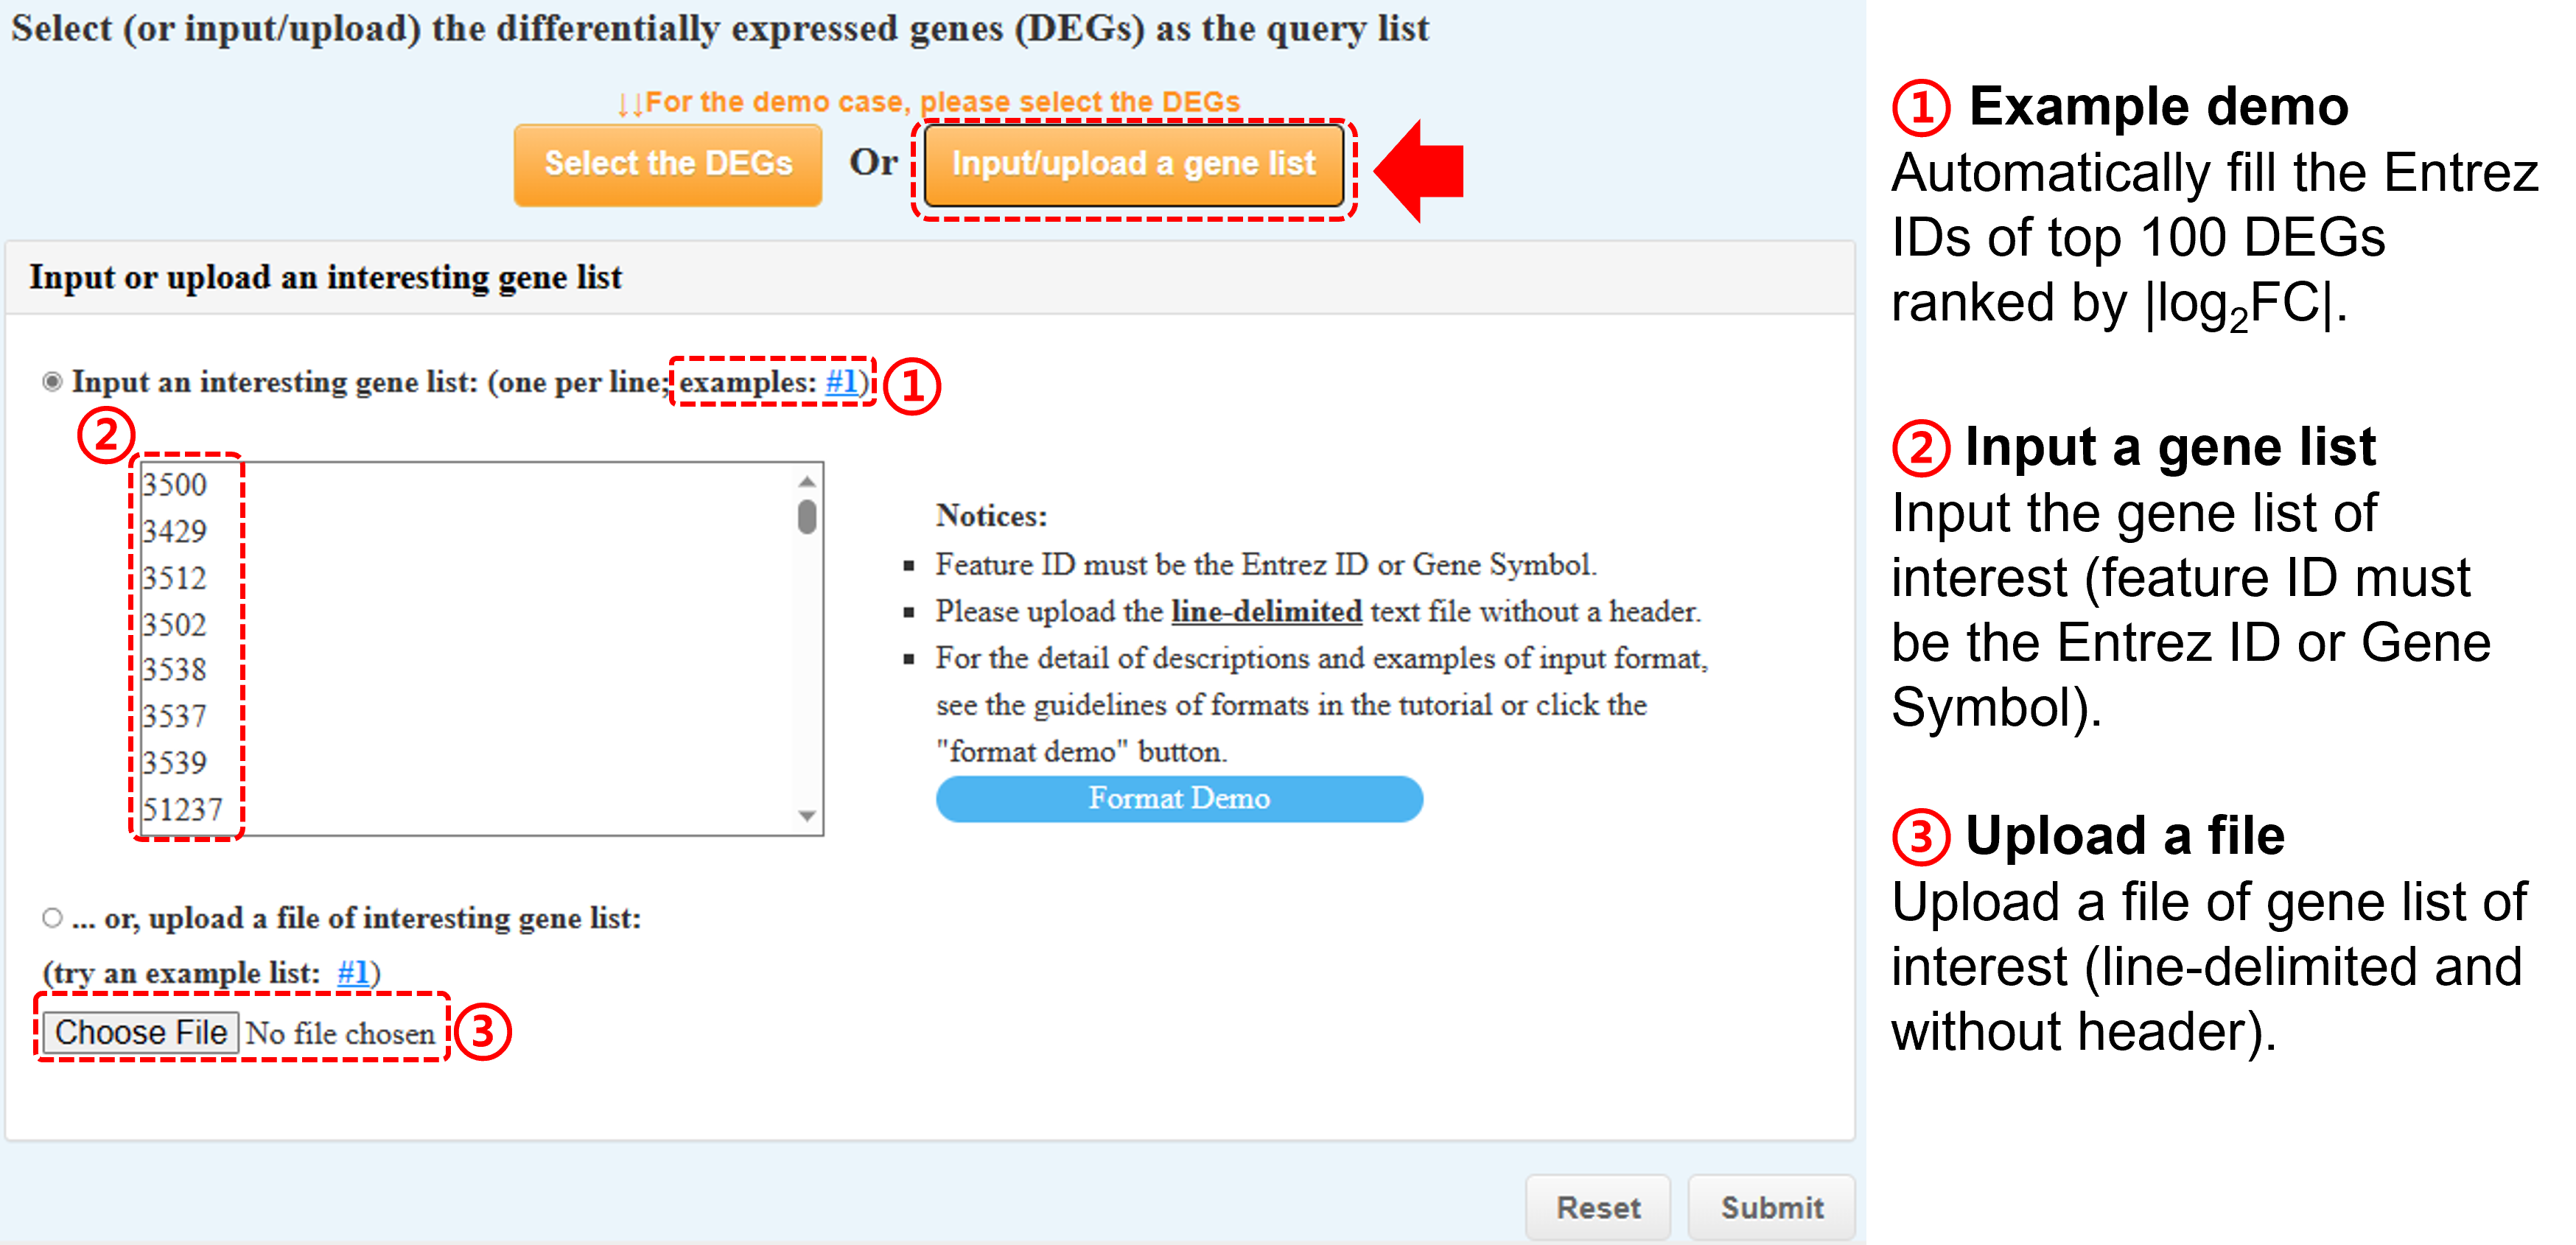
(b) Or input/upload a gene list
-
Input a gene list of interest (feature ID must be the Entrez ID or Gene Symbol)
or Upload a file of gene list (line-delimited and without header).
-
After submission, the overlapping genes between your gene list and DEGs will be pre-selected in the following table.
Please select/deselect one (or several) of them to generate the query DEG list for further analysis.
3. A collection of gene sets
-
(a) Upload a collection of gene sets of interest
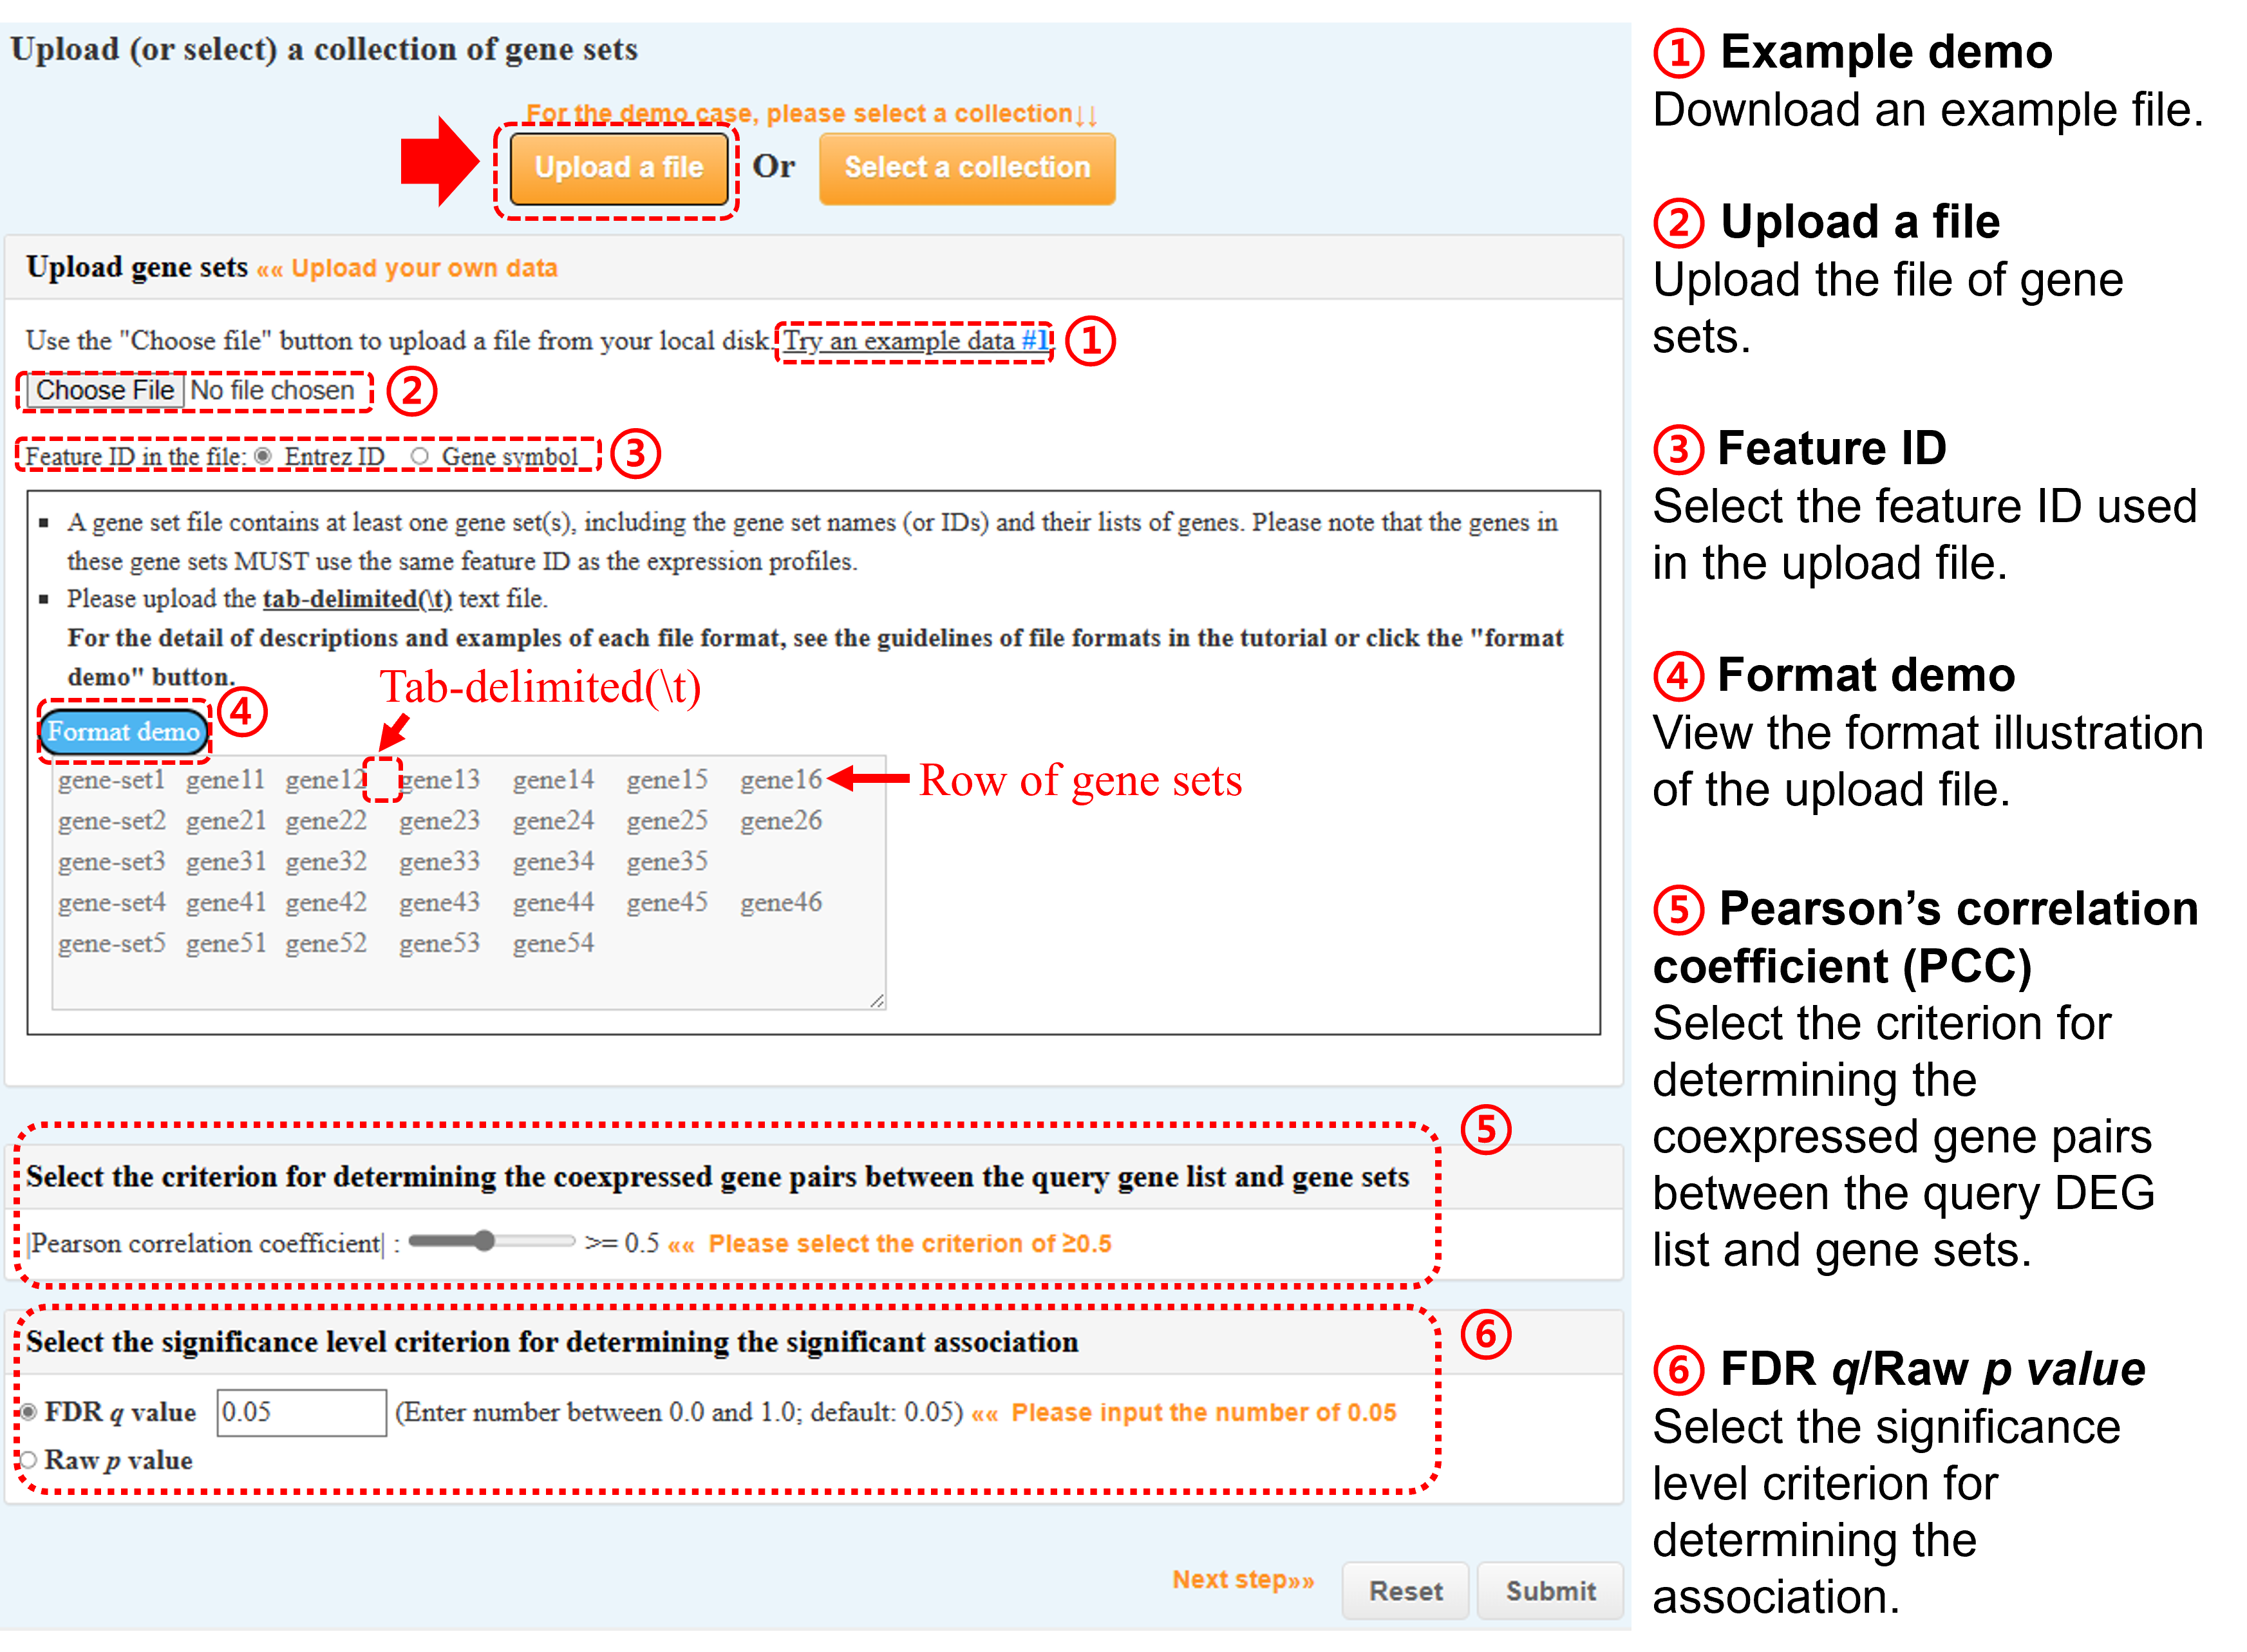
- Genes in these gene sets MUST use the same feature ID as the expression profiles.
-
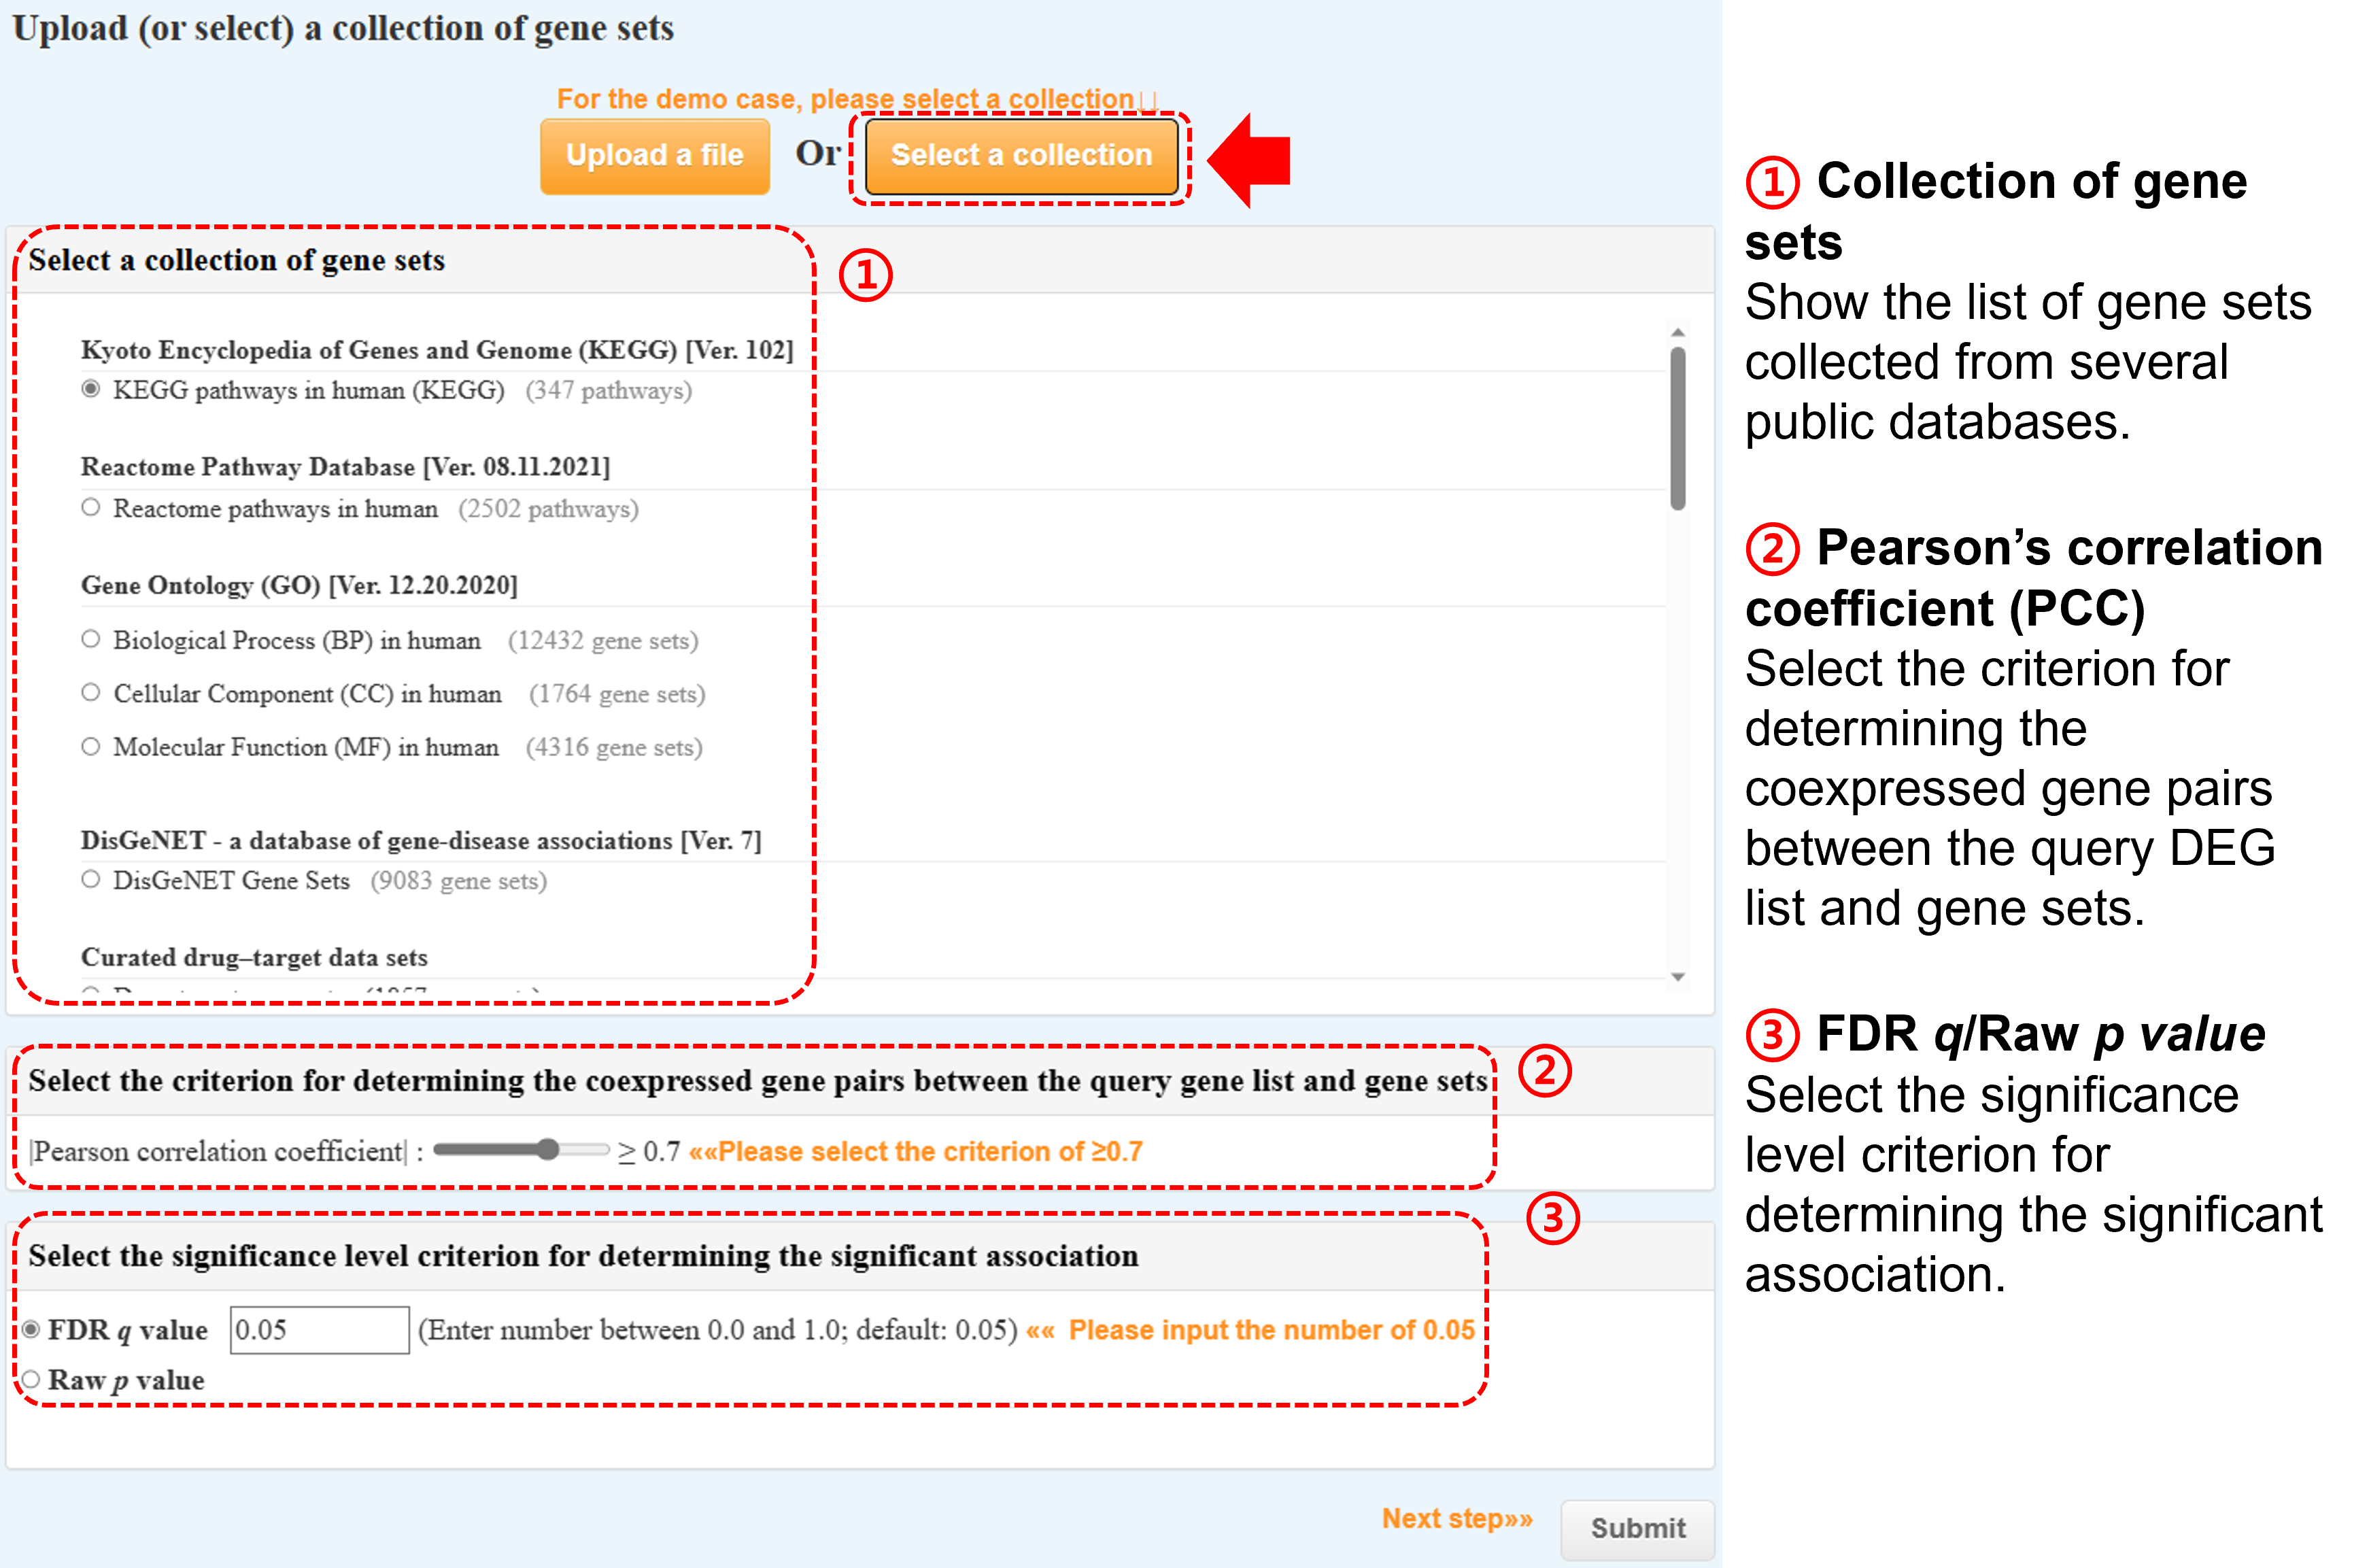
(b) Or select one category of our formatted gene sets collected from several public databases (monthly update)
Gscore Result Interpretation (Output)
1. DEG list information
-
(a) Dotplot
- You can download the dot plot of analysis data in PDF or SVG format.

-
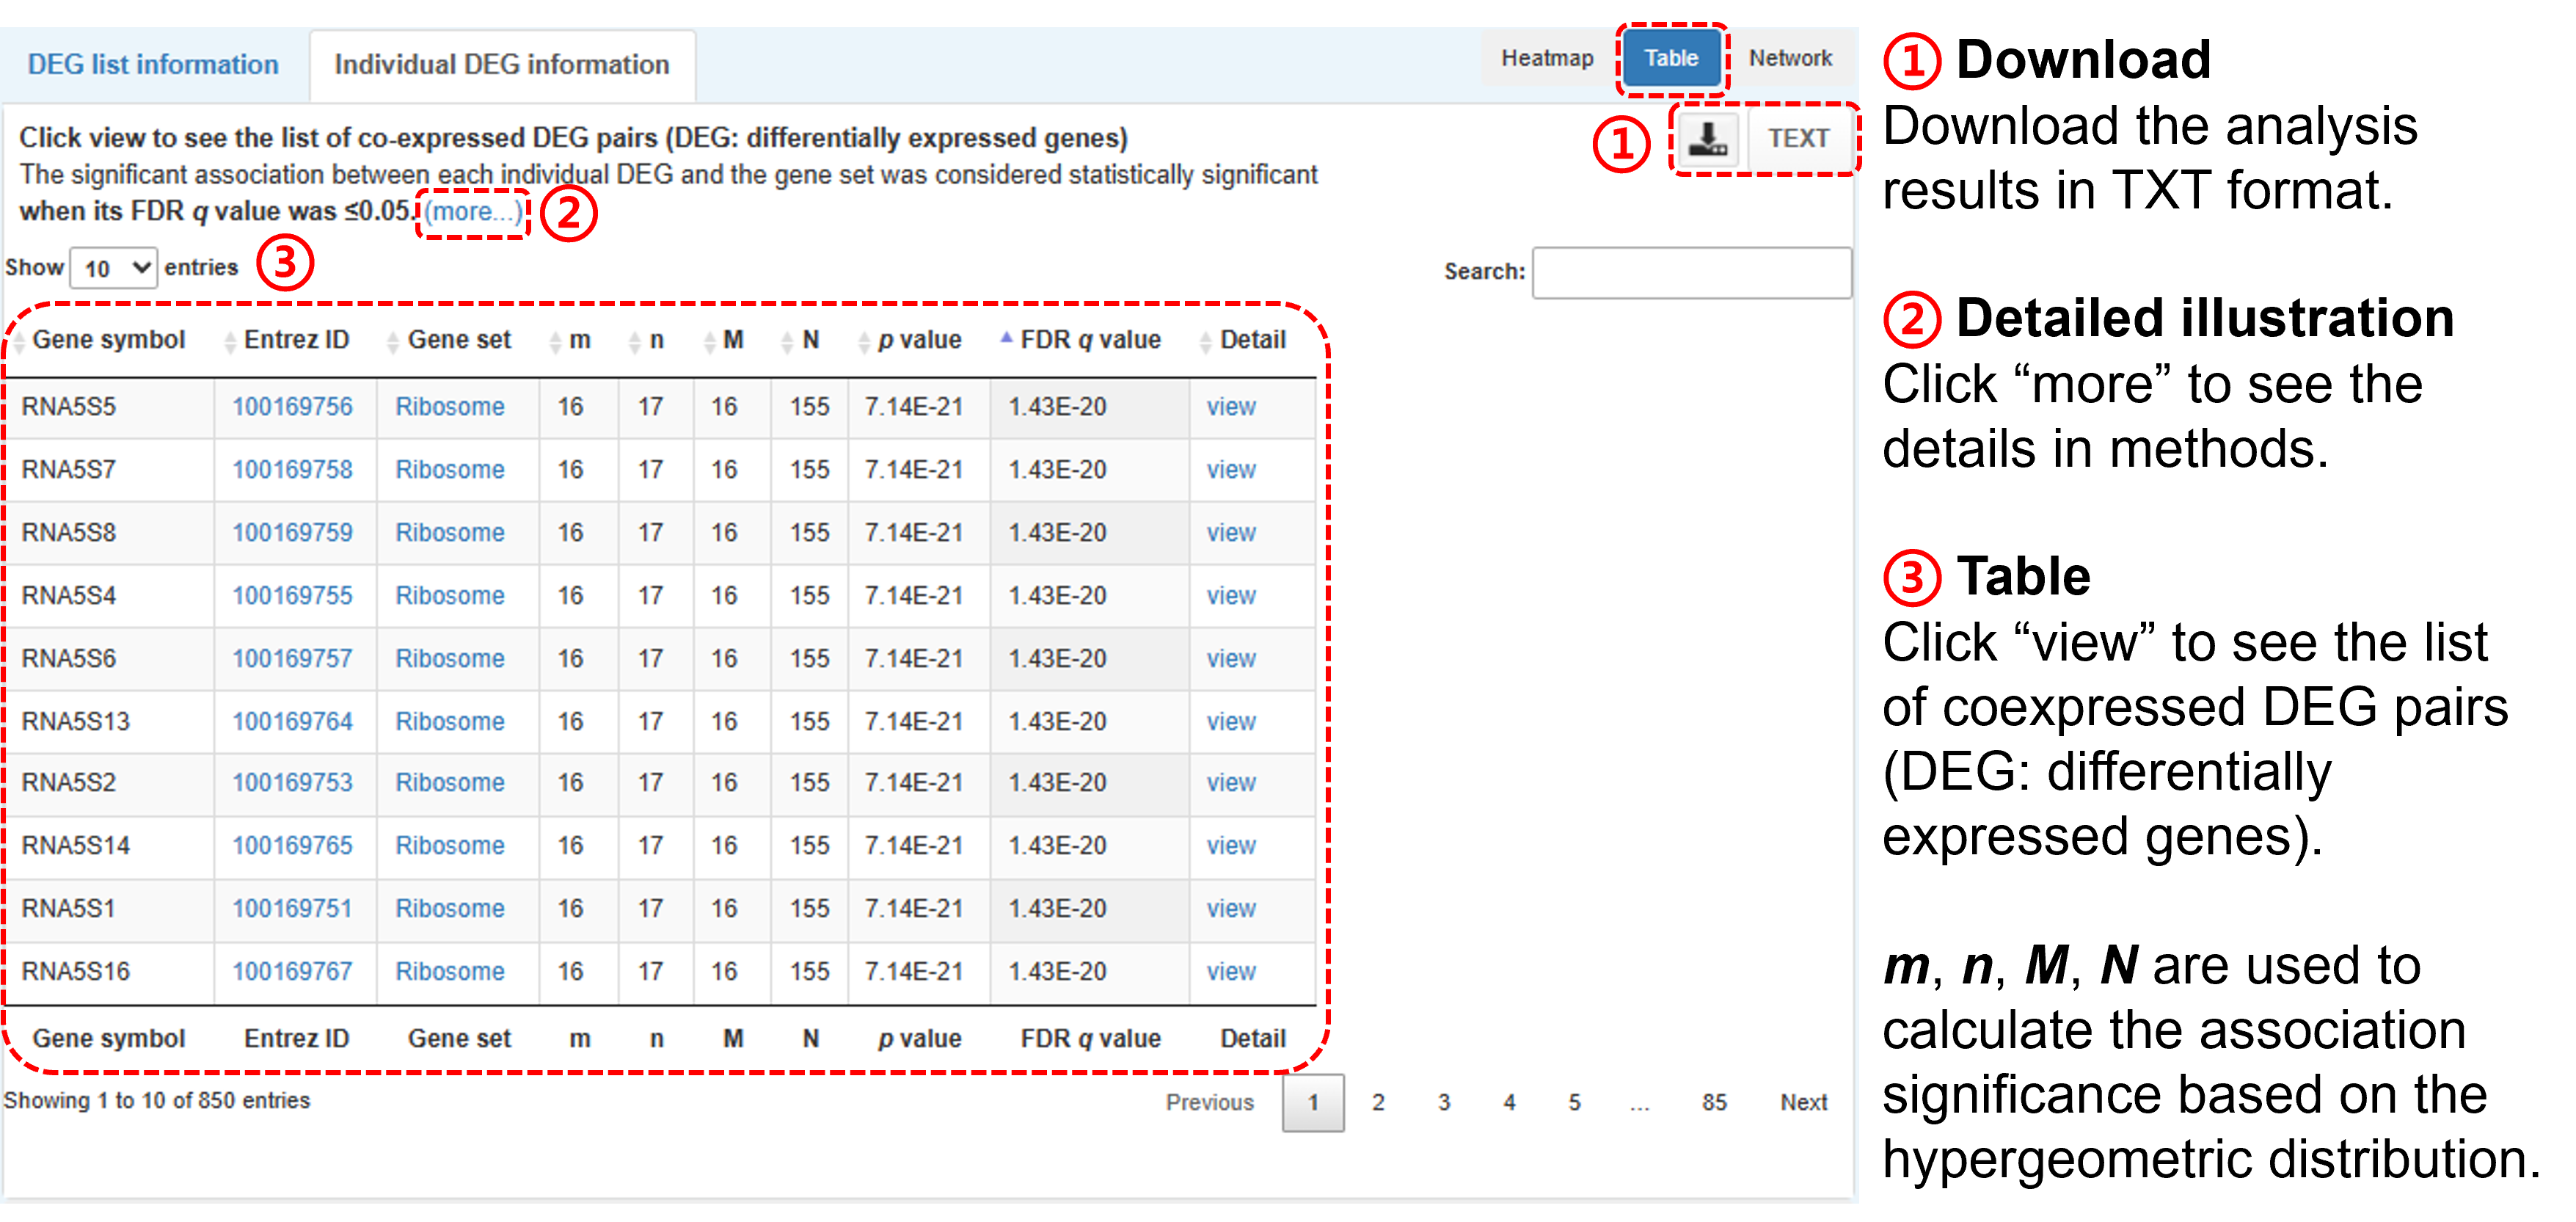
(b) Table
- The Gscore tool identifies the significant association of the DEG pairs between the query DEG list and the certain gene set was considered as statistically significant (i.e., having an association) when its FDR q value was ≤0.05
- You can download the analysis data in TXT format.
- The table is displayed by an interactive interface (i.e., DataTables plug-in for jQuery), including keyword search and value sorting.

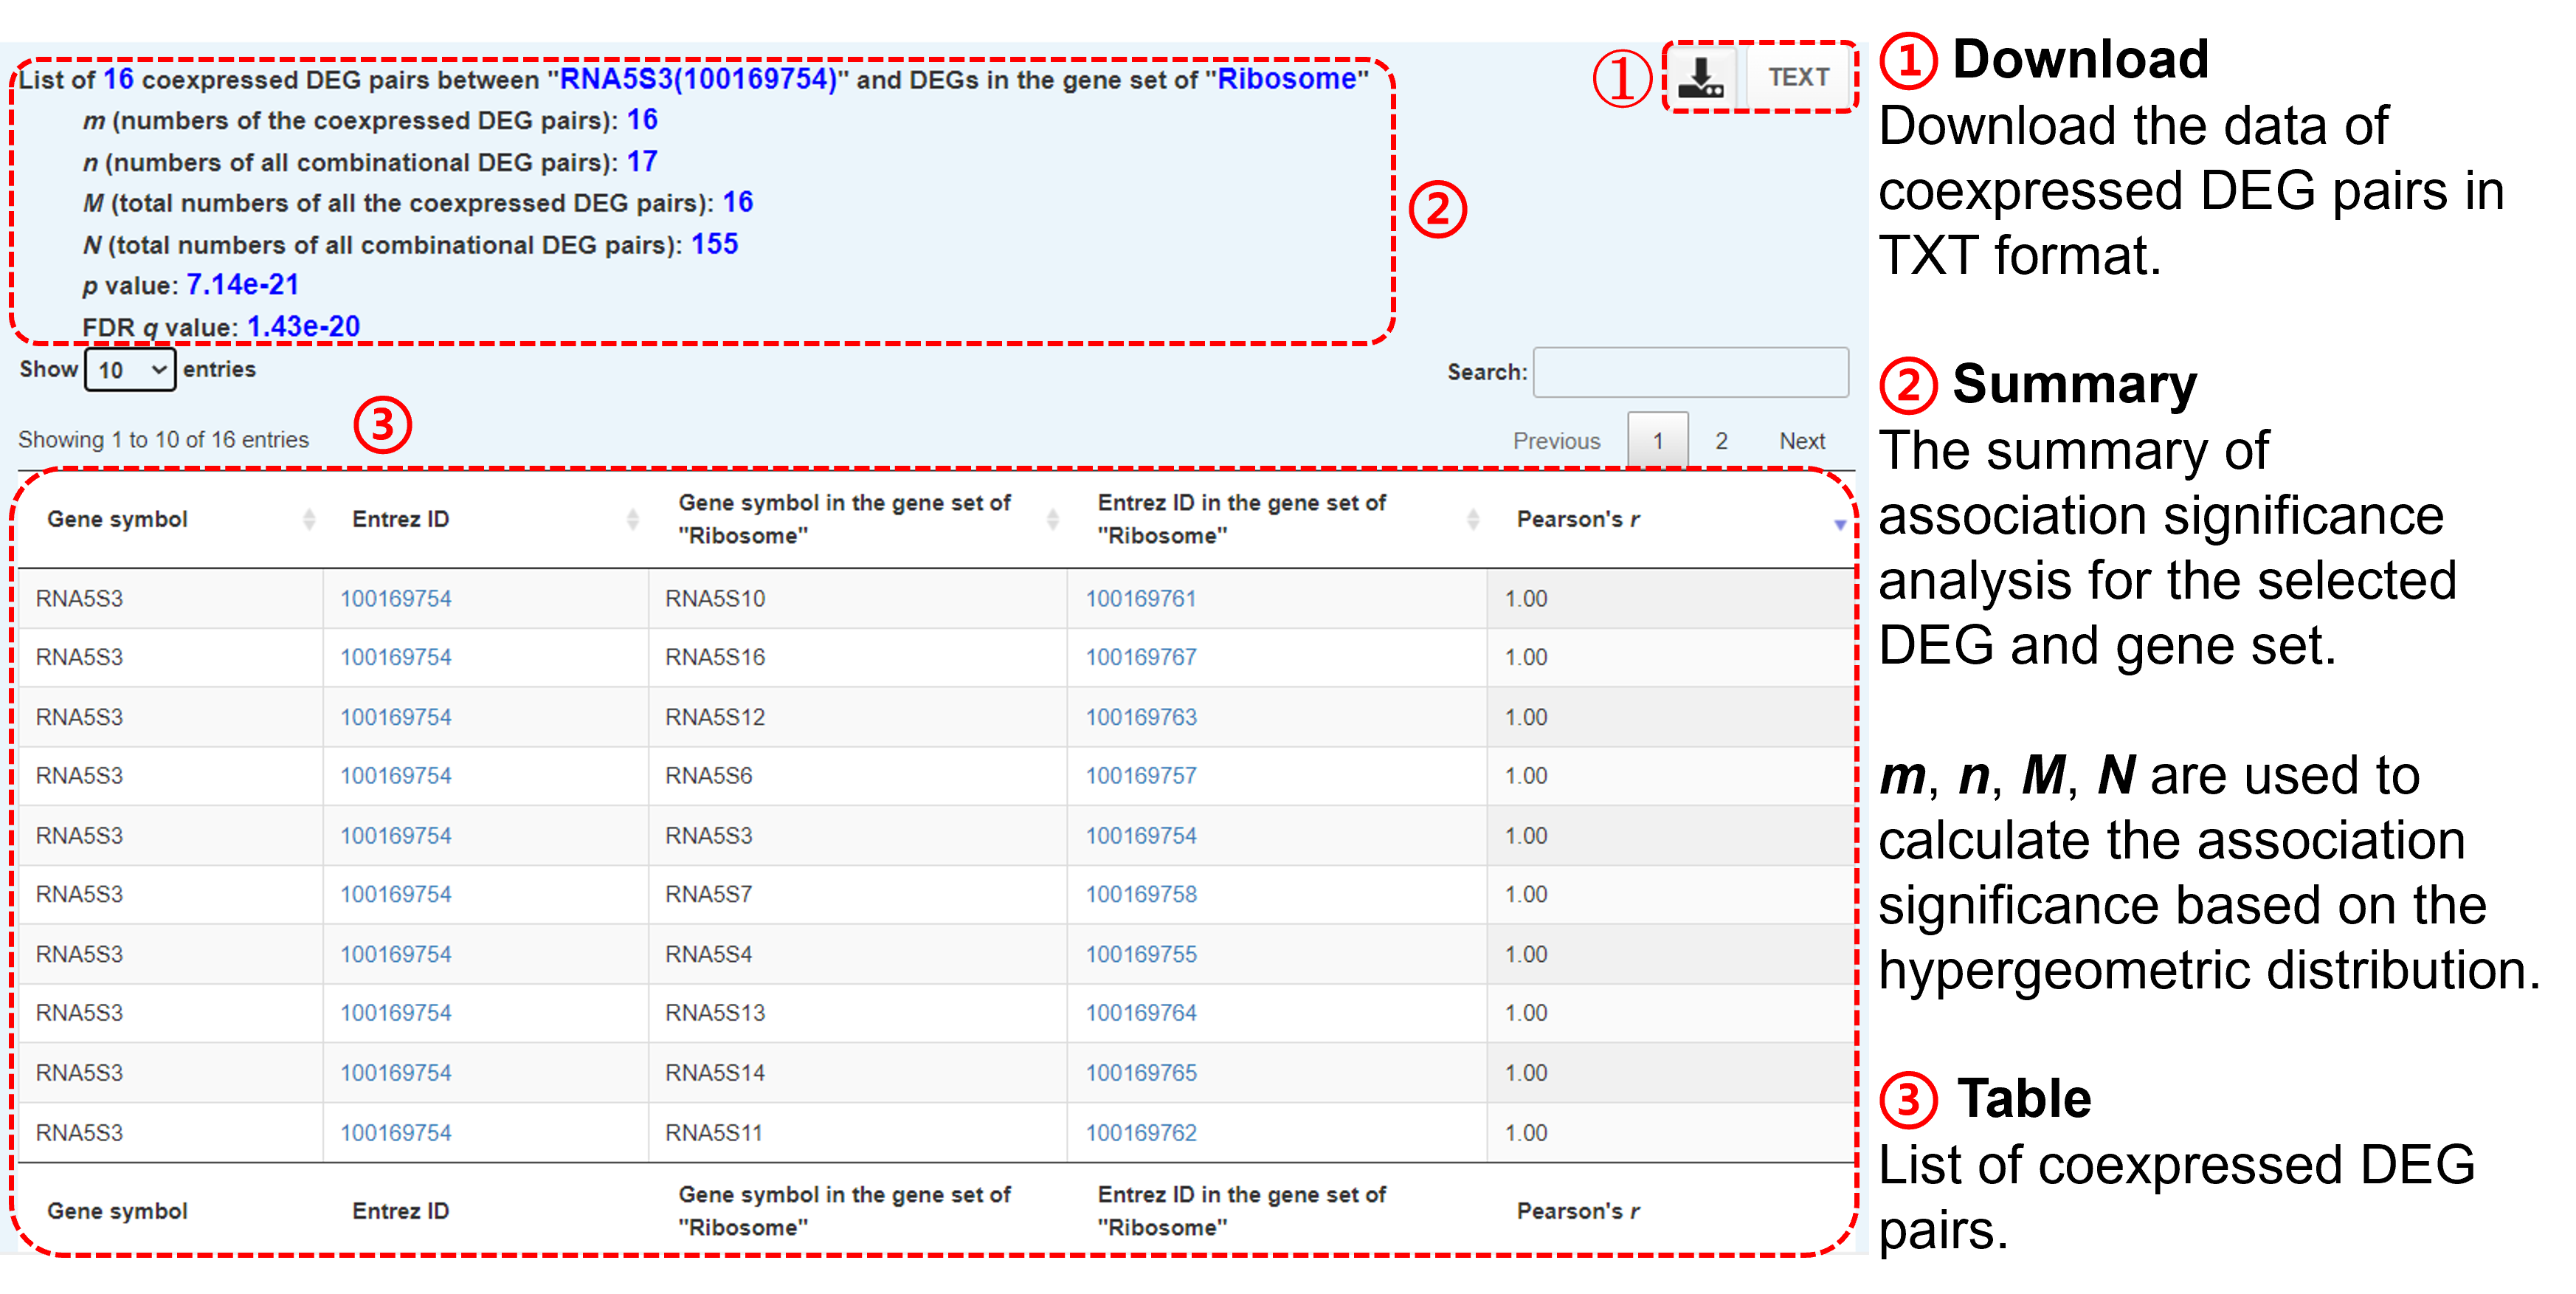
- Click "view" to see more details:

-
(c) Network
- The Gscore tool identifies the gene sets significantly associated with the query DEG list when their FDR q values are ≤0.05.
- The thickness of the network edges is proportional to the significance level of the gene set (-log10 FDR q value).
- You can download the network plot in PNG format.
- The network is displayed by an interactive interface (Cytoscape). You can select the maximum number of DEGs and signifiantly associated gene set, ranked by FDR q value, to show.

- Click each red rectangle (or edge) to show the list of coexpressed DEG pairs between the gene set and the query gene list in the pop-up window: e.g. Coronavirus disease - COVID-19.

- Click each blue circle (or edge) to show the list of coexpressed DEG pairs between the individual DEG and other DEGs in the selected gene set in the pop-up window: e.g. coexpressed DEG pairs between EPSTI1 and DEGs in the gene set of Coronavirus disease - COVID-19.

2. Individual gene information
-
(a) Heatmap
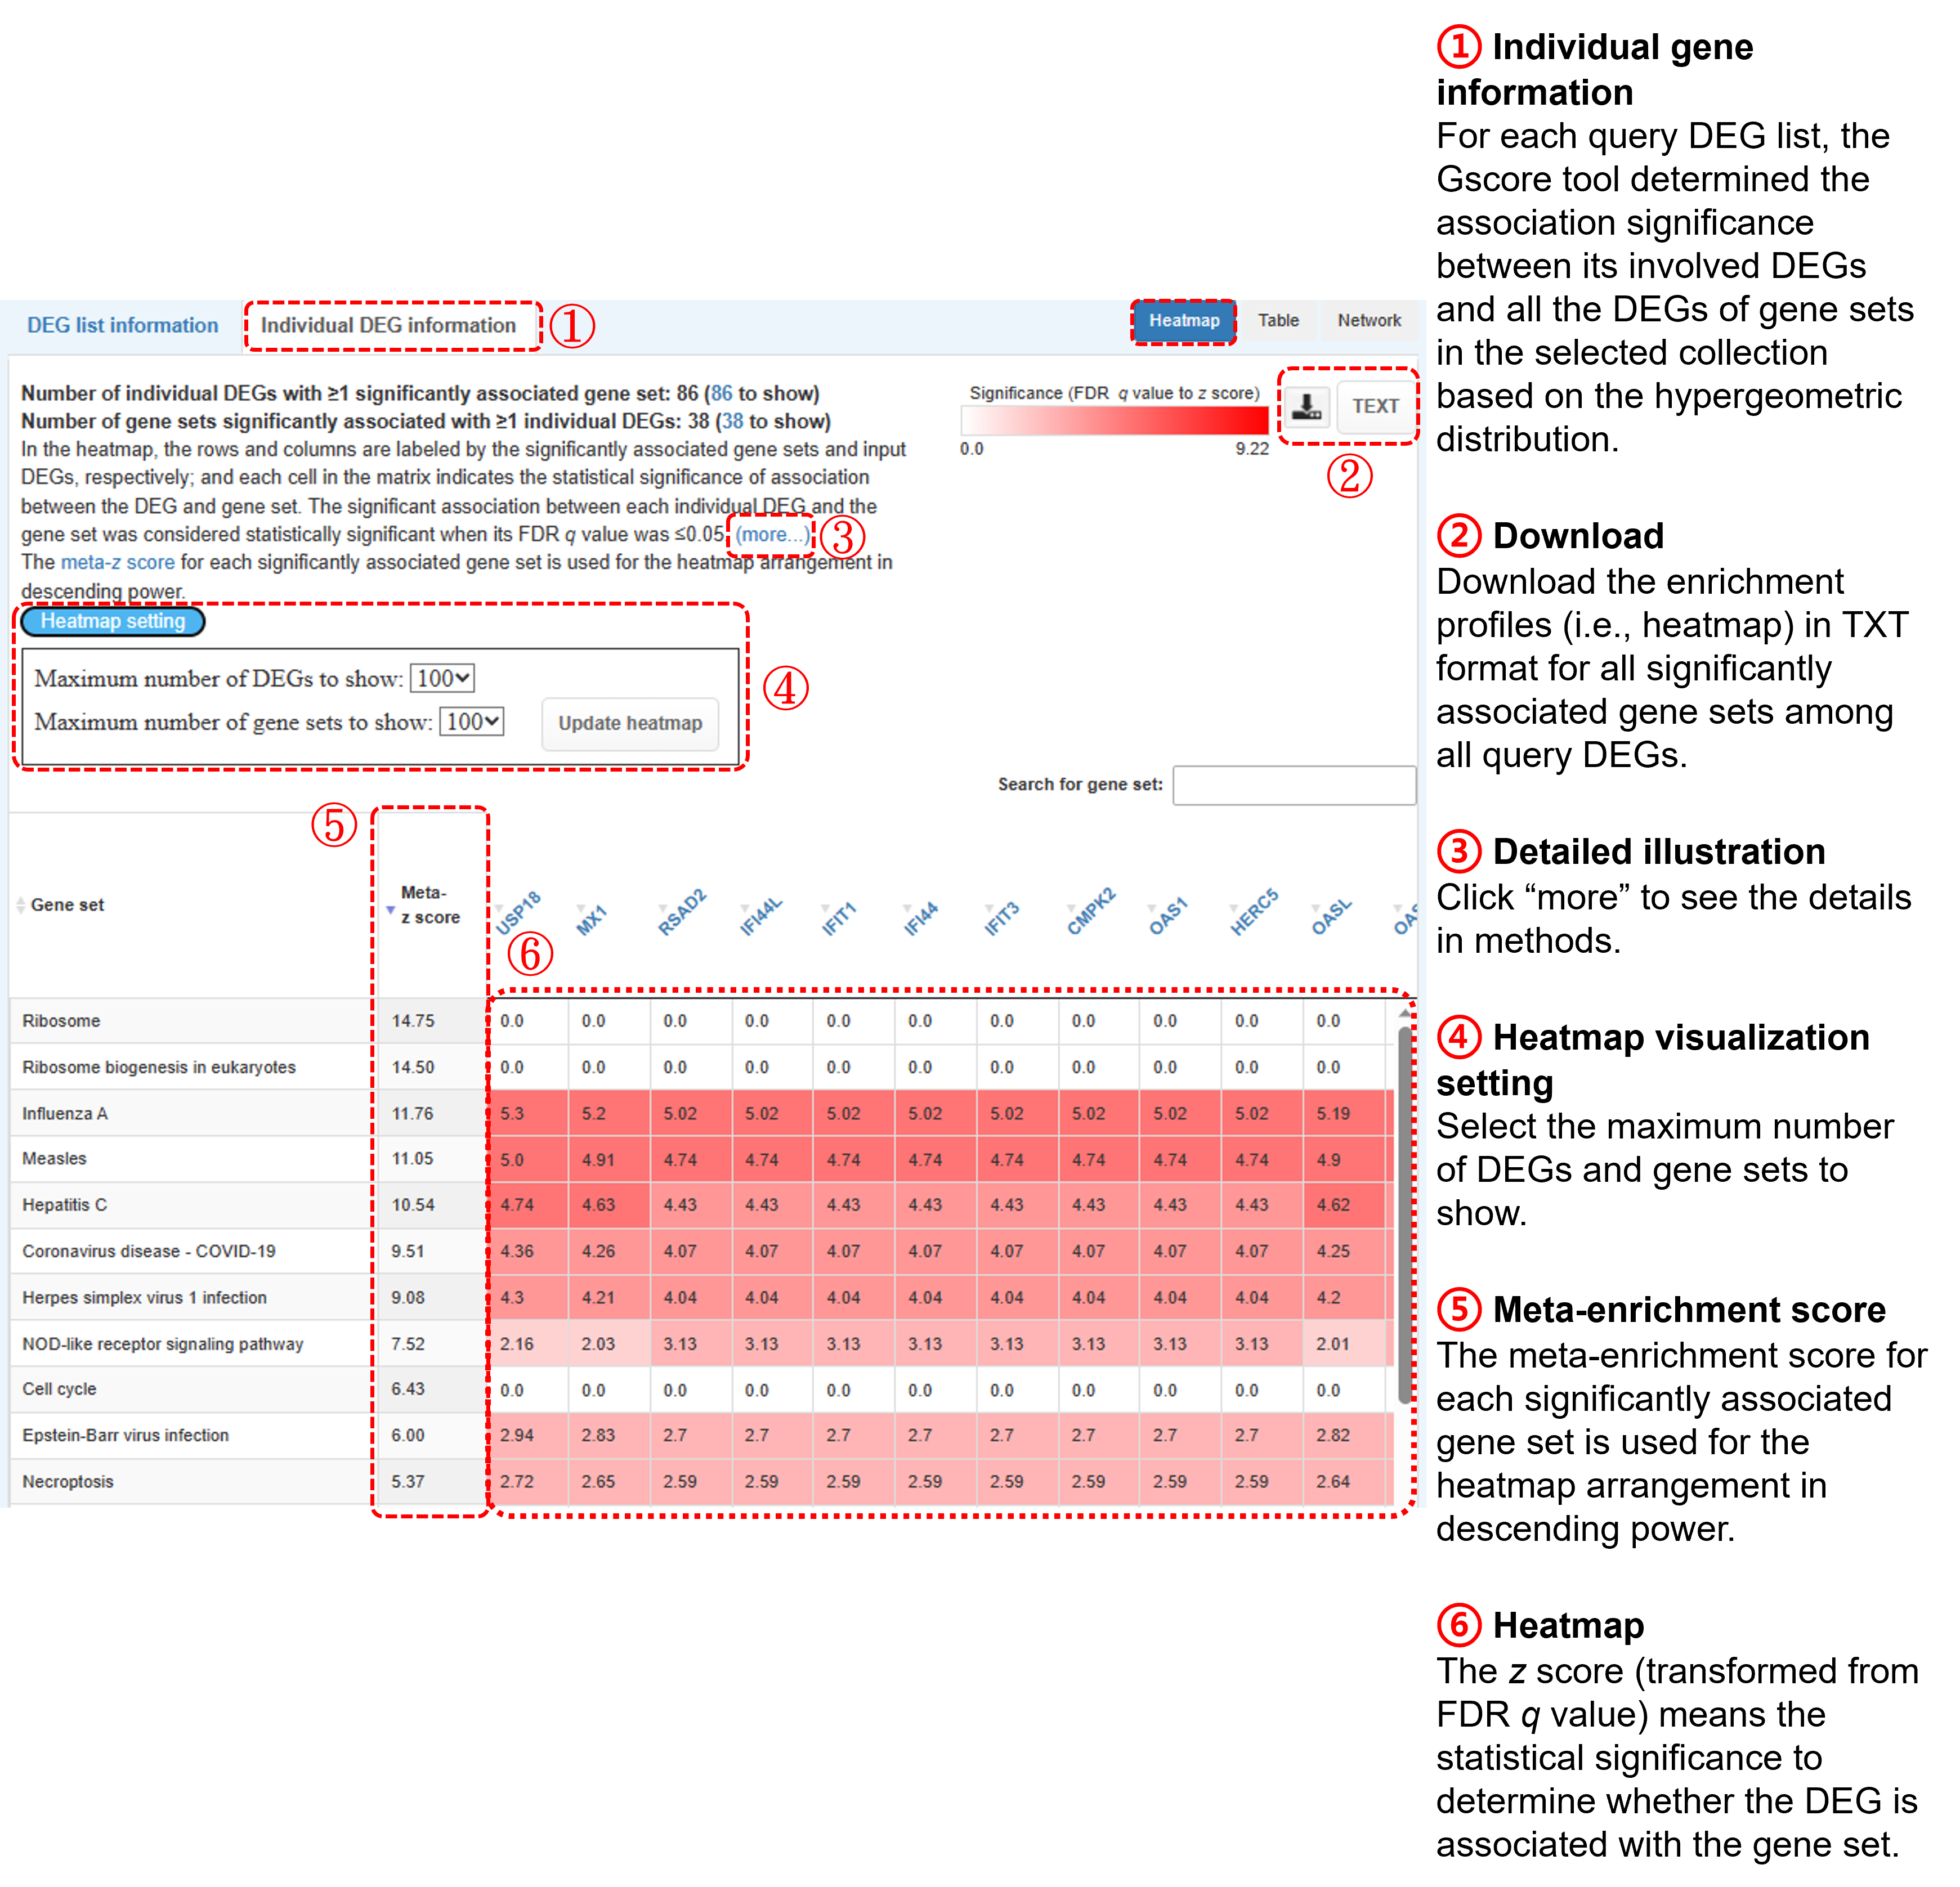
- In the heatmap, the rows and columns are labeled by the significantly associated gene sets and input genes, respectively; and each cell in the matrix indicates the enrichment significance of association between the DEG and gene set.
- The heatmap is displayed by an interactive table interface (i.e., DataTables plug-in for jQuery), including keyword search and value sorting.
-
To assess a certain gene set with association significance across all DEGs in the query DEG list, the
FDR q value for each association between the DEG and gene set was transformed to a z score (i.e., enrichment score, Ei), and then these Ei values among all query DEGs were further summarized using Stouffer’s unweighted Z-transform test (i.e., meta-z score). The meta-z score is defined as

where Nc is the total number of query DEGs. The meta-z score for each significantly associated gene set is used for the heatmap arrangement in descending power. Please note that the heatmap only displays the 500 top-ranking gene sets. You can download the enrichment profiles in TXT format for all significantly associated gene sets among all query DEGs.
-
(b) Table
- The table is displayed by an interactive interface (i.e., DataTables plug-in for jQuery), including keyword search and value sorting.
- You can download the analysis data in TXT format.
- Click "view" to see more details:
-
(c) Network
- The Gscore tool identifies the significant associated gene set between the individual DEG when its FDR q value is ≤0.05. The thickness of the network edge represent the significance of the gene set
- You can download the network plot in PNG format.
- The network is displayed by an interactive interface (Cytoscape).

- Click each red rectangle(or edge) to show the list of coexpressed DEG pairs of the gene set, or the each blue circle(or edge) to show the list of signifiantly associated gene set of the individual DEG.

Methods
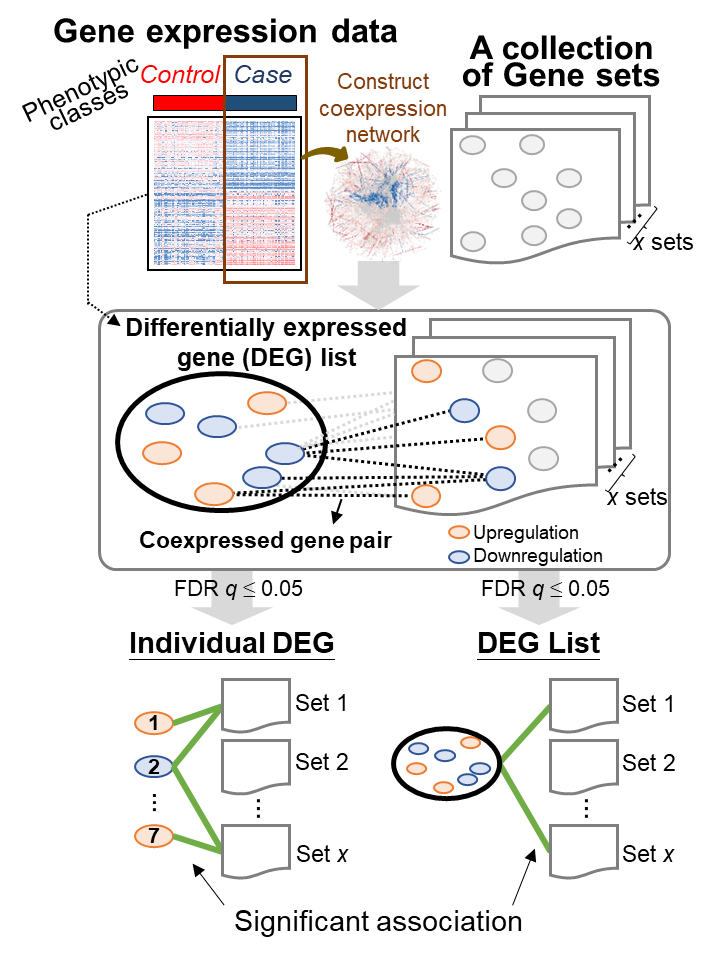
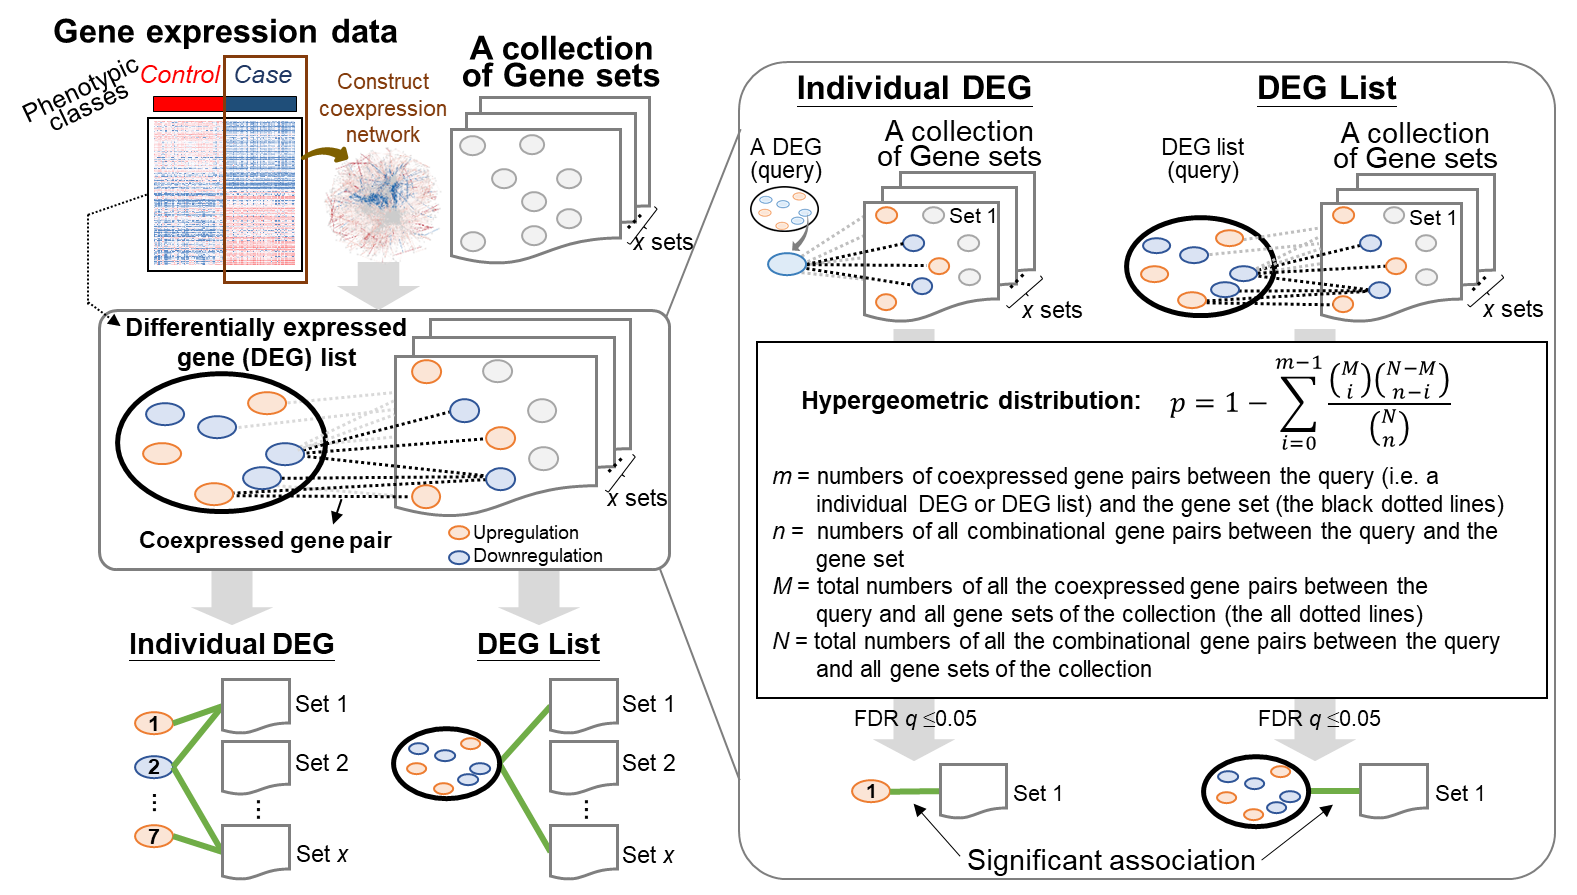
(1). For each input gene expression dataset with samples belonging to two classes, we first identified the DEGs between control and case samples. Then, we constructed a coexpression network using the expression profiles of the case samples, in which two DEGs with a Pearson correlation coefficient (|Pearson’s r|) ≥ c across case samples were considered a coexpressed gene pair. Here, c can be set by the user, for example, to 0.3 (low), 0.5 (moderate), or 0.7 (high). Note that genes with identical expression values across all “case” samples are ignored when calculating the correlation.
(2). For each DEG in the query list, Gscore1 first uses the coexpressed gene pairs between that DEG and all the DEGs of a gene set in the selected collection to determine the association significance for this gene set based on the hypergeometric distribution2,3,4 as follows:

where m and n are, respectively, the numbers of coexpressed gene pairs and all possible gene pairs between each DEG in the query DEG list and all the DEGs in a specific gene set; for instance, the values for m and n between DEG a and Gene Set A (containing 5 DEGs) in Figure A are 3 (red dotted lines) and 5, respectively. M and N are, respectively, the total numbers of all the coexpressed gene pairs and all possible gene pairs between each DEG in the query DEG list and all the DEGs in the gene sets of the selected collection. The FDR q value for multiple hypothesis testing with the Benjamini–Hochberg method was used, and the false discovery rate was controlled at 5%. Here, the association between the DEG in the query DEG list and a certain gene set was considered statistically significant when its q value was ≤ 0.05.
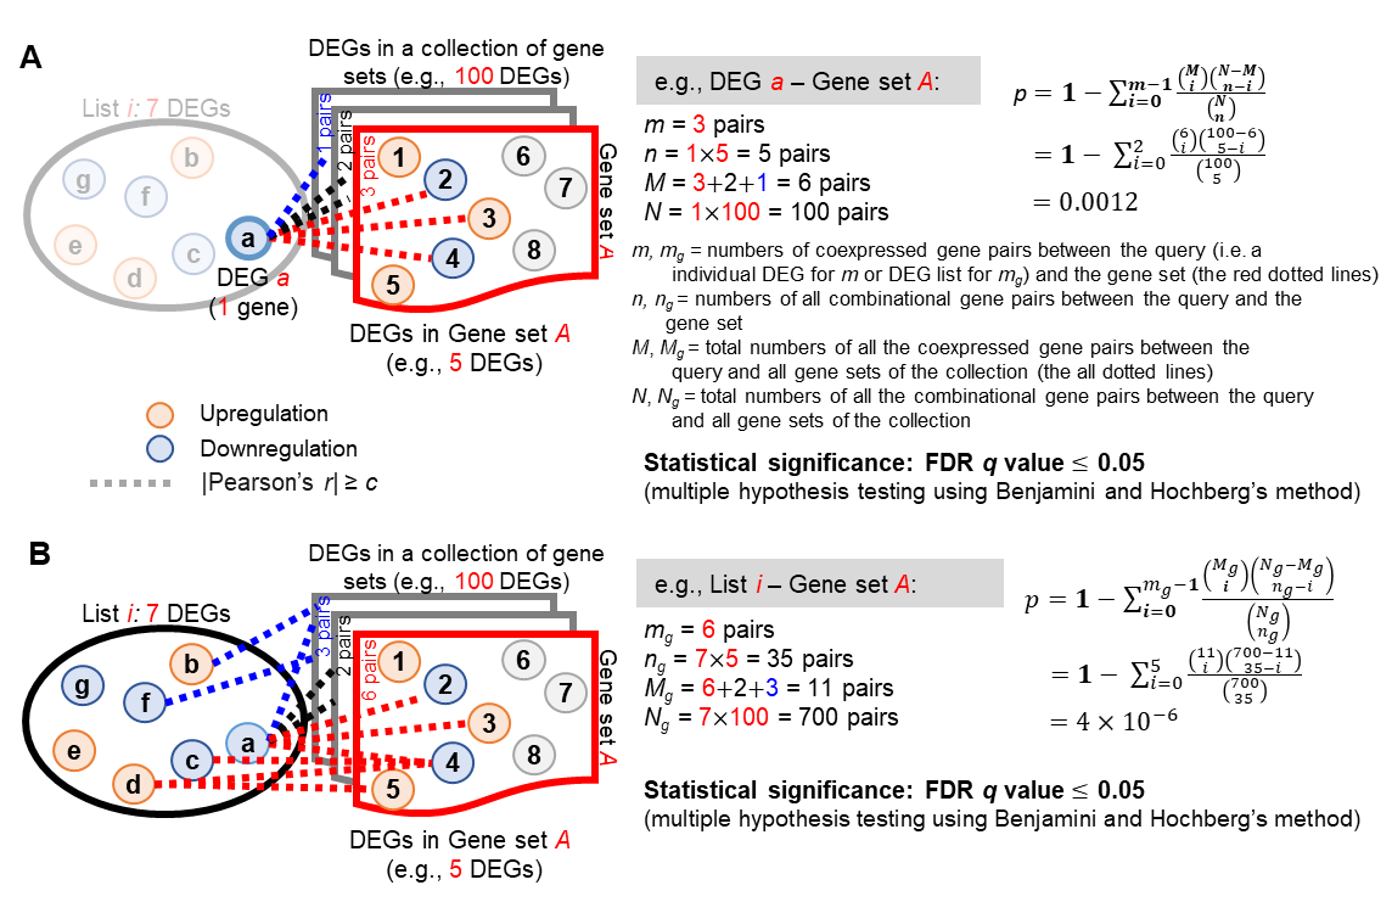
(3). For the query DEG list, Gscore1 further measured the statistical significance of association for a specific gene set based on the coexpressed gene pairs between all of the involved DEGs and all the DEGs of this gene set in the selected collection (Figure B). Then, we computed the p value of the hypergeometric distribution2,3,4 as

where mg and ng are, respectively, the numbers of coexpressed gene pairs and all the possible gene pairs, respectively, between all the DEGs of the query list and all the DEGs in a specific gene set; for example, mg (i.e., observed coexpressed gene pairs; red dotted lines) and ng between List i (including 7 involved DEGs) and Gene Set A (containing 5 DEGs) in Figure B are 6 and 35, respectively. Mg and Ng are, respectively, the total numbers of all the coexpressed gene pairs and all possible gene pairs between all the DEGs of the query list and all the DEGs of gene sets in the selected collection.
Reference:
1.Chang, L. Y. ,Lee, M.Z., et al. Gene set correlation enrichment analysis for interpreting and annotating gene expression profiles. Nucleic Acids Res 52, Page e17.
2. Bandyopadhyay, S., et al. Rewiring of genetic networks in response to DNA damage. Science 330, 1385-1389 (2010).
3. Lin, C.Y., Lin, Y.W., Yu, S.W., Lo, Y.S. & Yang, J.M. MoNetFamily: a web server to infer homologous modules and module-module interaction networks in vertebrates. Nucleic Acids Res 40, W263-W270 (2012).
4. Lin, C. Y., et al. Membrane protein-regulated networks across human cancers. Nature Commun 10, 3131 (2019).
5. Benjamini, Y. & Hochberg, Y. Controlling the false discovery rate-a practical and powerful approach to multiple testing. J. R. Stat. Soc. B Methodol. 57, 289–300 (1995).
Browser compatibility
| OS | Version | Chrome | Safari | Microsoft Edge | Firefox |
|---|---|---|---|---|---|
| Linux | Ubuntu 18.04.3 LTS | 79.0.3945.88 | n/a | n/a | 71.0 |
| macOS | Mojave 10.14.6 | 79.0.3945.88 | 13.0.4 | n/a | 71.0 |
| Windows | 10 Pro(Version 1903) | 79.0.3945.88 | n/a | 44.18362.449.0 | 71.0 |